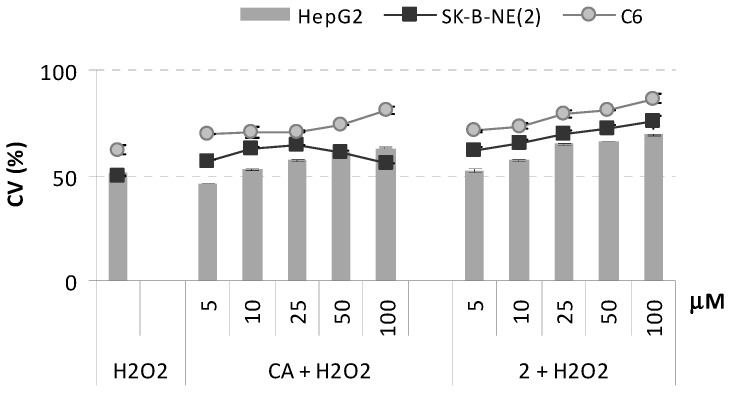
Figure 6.
Cytoprotective effects of CA, and PNA-CA dimer 2 against H2O2 (500 µM) induced oxidative stress on HepG2, SK-B-NE(2), and C6 cell lines. Values of Cell Viability (CV, %), reported as percentage vs. an untreated control, are the mean value ± SD of measurements carried out on 3 samples (n = 3) analyzed twelve times.

