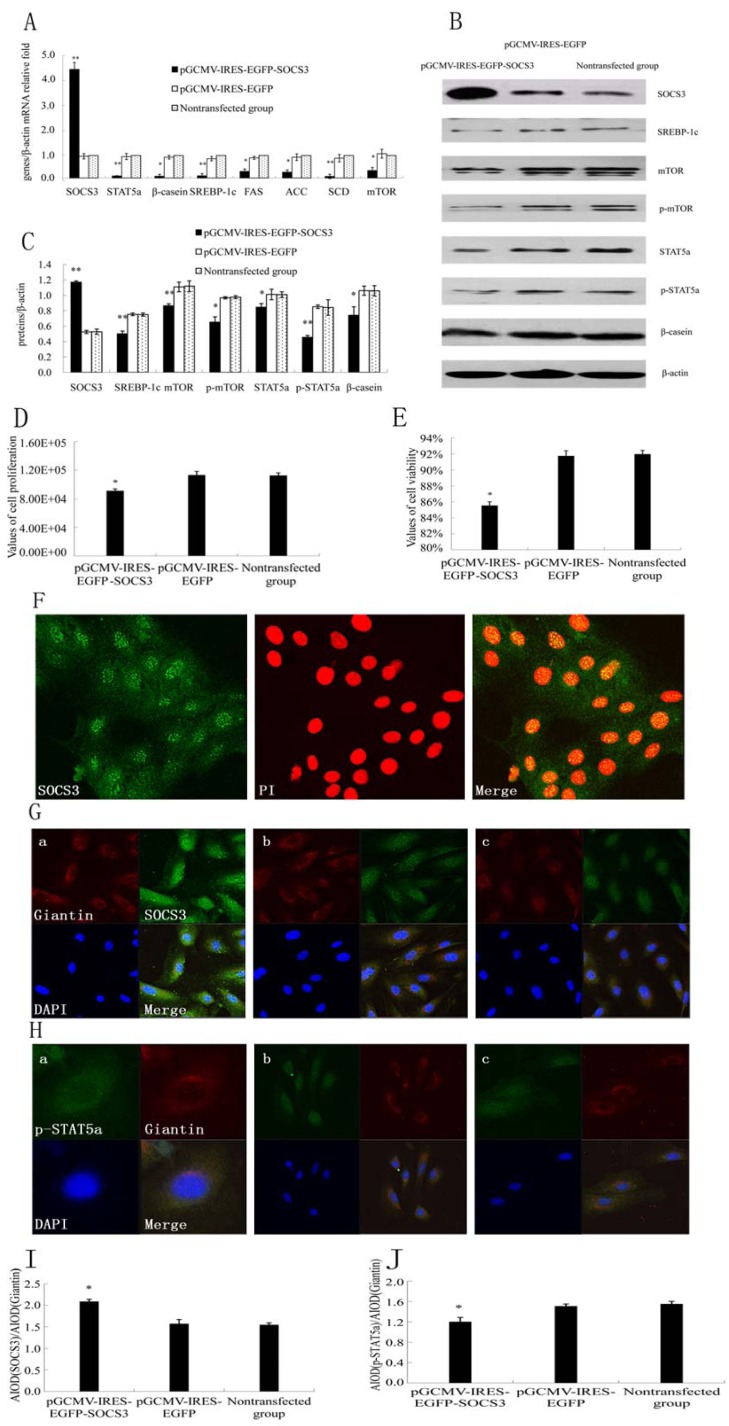
Figure 1.
Effect of SOCS3 overexpression on lactation and proliferation in DCMECs. DCMECs were divided into three groups: transfected with a SOCS3 expression construct or empty vector (control group), nontransfected, grew for 48 h. (A) Gene expressions in DCMECs growing for 48 h were detected using qRT-PCR and normalized to β-actin mRNA expression; (B) Western blotting results of SOCS3, STAT5a, p-STAT5a, mTOR, p-mTOR, SREBP-1c, β-casein and β-actin in DCMECs growing for 48 h after SOCS3 overexpression; (C) Results of gray scale scan of SOCS3, STAT5a, p-STAT5a, mTOR, p-mTOR, SREBP-1c and β-casein/β-actin relative fold by western blotting after SOCS3 overexpression; (D,E) Proliferation and viability of DCMECs growing for 24 h were measured using CASY; (F) Localization of SOCS3. SOCS3 (green), nuclei(red). Scale bars = 75 μm. (G) Overexpressed SOCS3 proteins had higher levels of nuclear localization of DCMECs. a: Cells were transfected with a SOCS3 expression construct and grew for 24 h; b: Cells were transfected with an empty vector and grew for 24 h; c: Nontransfected cells. SOCS3(green), Giantin(Red) and DAPI(blue). Scale bars = 20 μm; (H) Immunofluorescent staining for p-STAT5a was performed on DCMECs. a: Cells were transfected with a SOCS3 expression construct and grew for 24 h; Scale bars = 75 μm; b: Cells were transfected with an empty vector and grew for 24 h ; Scale bars = 20 μm; c: Nontransfected cells. p-STAT5 (green), Giantian (red) and nuclei were counterstained with DAPI (blue). Scale bars = 20 μm; (I,J) The analysis of fluorescence staining after SOCS3 overexpression. Different superscripts denote significant difference relative to controls. * or ** means significant difference compared with negative control (p < 0.05 or p < 0.01).

