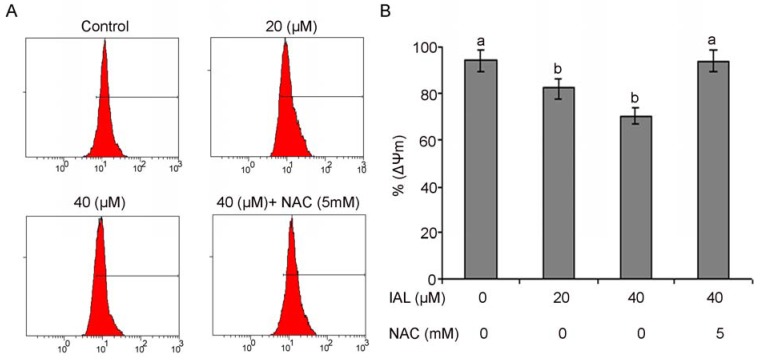
Figure 7.
The effects of isoalantolactone on mitochondrial transmembrane potential of PC3 cells were determined by flow cytometry. (A) The values indicate the percentages of rhodamine 123 fluorescence in the PC3 cells treated without and with 20 and 40 µM of isoalantolactone (IAL) for 24 h in the presence or absence of NAC. (B) Data are expressed as Mean ± SD (n = 3). Columns not sharing the same superscript letter differ significantly (p < 0.05).

