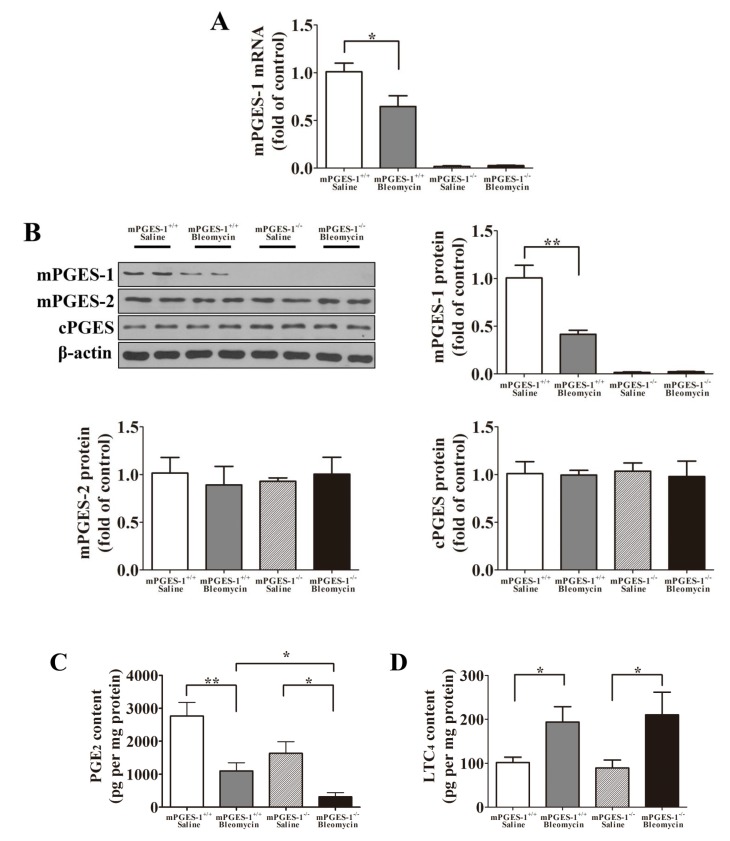
Figure 2.
The mRNA and protein levels of mPGES-1, mPGES-2 and cPGES in addition to PGE2 content in the lungs of mice on day 28 after instillation. (A) Statistical chart of mPGES-1 mRNA expression; (B) Representative western blot images and scanning densitometry of mPGES-1, mPGES-2 and cPGES protein expression; (C) The PGE2 content in the lungs of mPGES-1+/+ mice and mPGES-1−/− mice receiving bleomycin or saline; (D) The LTC4 content in the lungs of mPGES-1+/+ mice and mPGES-1−/− mice receiving bleomycin or saline. Results are expressed as means ± SEM (n = 4–6 mice per group) (* p < 0.05, ** p < 0.01).

