Table 3.
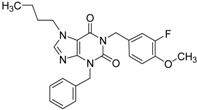
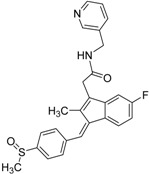
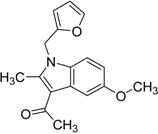
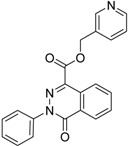
Distribution of the T3D values in the entire second round selection library and within the library having fusion score above 1.5.
| ID | Structure | Analogues in the 1341 Set | Lowest T3D | Analogues in the 233 Set | Lowest T3D | Percentage in the 233 Set |
|---|---|---|---|---|---|---|
| 2 |

|
155 | 0.24 | 30 | 0.69 | 19.35 |
| 3 |

|
476 | 0.19 | 16 | 0.63 | 3.36 |
| 5 |

|
27 | 0.33 | 9 | 1.00 | 33.33 |
| 4 |

|
13 | 0.28 | 6 | 0.72 | 46.15 |
| 1 |

|
273 | 0.30 | 116 | 0.62 | 42.49 |
| 6 |

|
117 | 0.29 | 12 | 0.70 | 10.26 |
| 7 |

|
280 | 0.28 | 44 | 0.64 | 15.71 |
