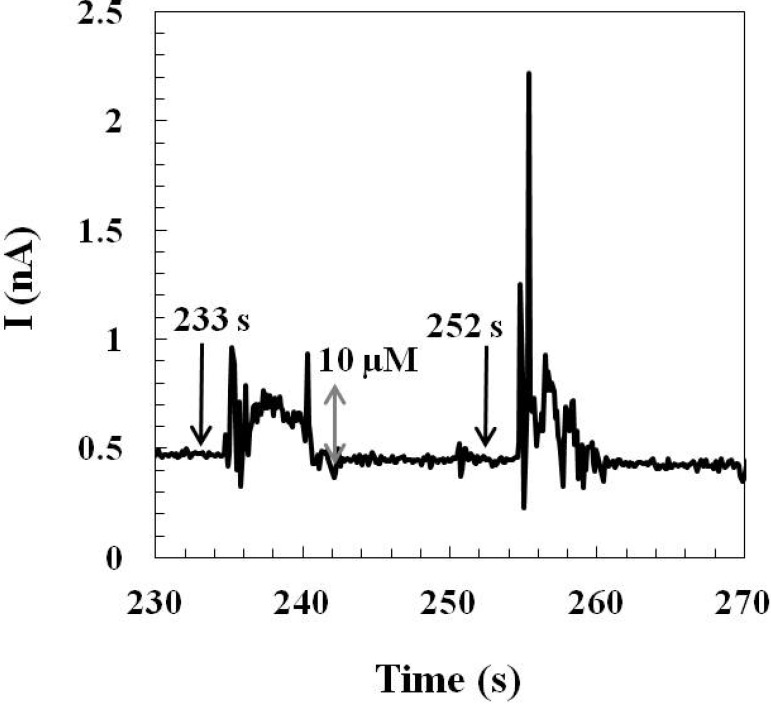
Figure 5.
A representative result of the stress-induced glutamate sensing current corresponding to the glutamate release in the hypothalamus of an awake, freely moving rat. Arrows indicate the timing of each tail pinch. A calibration bar (gray double-sided arrow) is shown on the plot. The calibration bar was determined by the slope of the post-calibration curve of each implanted glutamate sensor.

