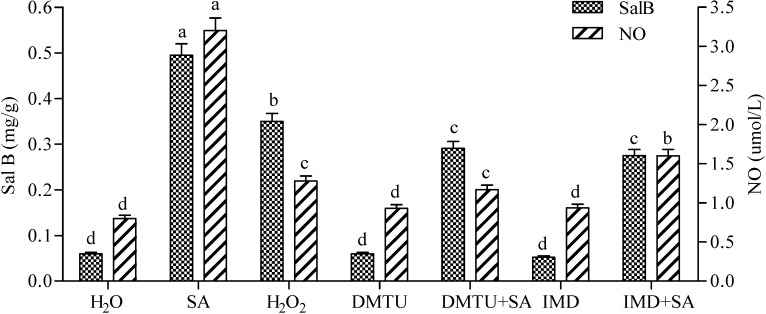
Figure 4.
Effects of SA, exogenous H2O2, IMD, DMTU and complex treatments on the production of Sal B and NO in Salvia miltiorrhiza cell cultures. The concentrations for SA, H2O2, IMD, CAT and DMTU were the same as Figure 1. The detection time for determining both contents of NO and Sal B was the same as Figure 3. Different lowercase letters represented significance at 0.05.

