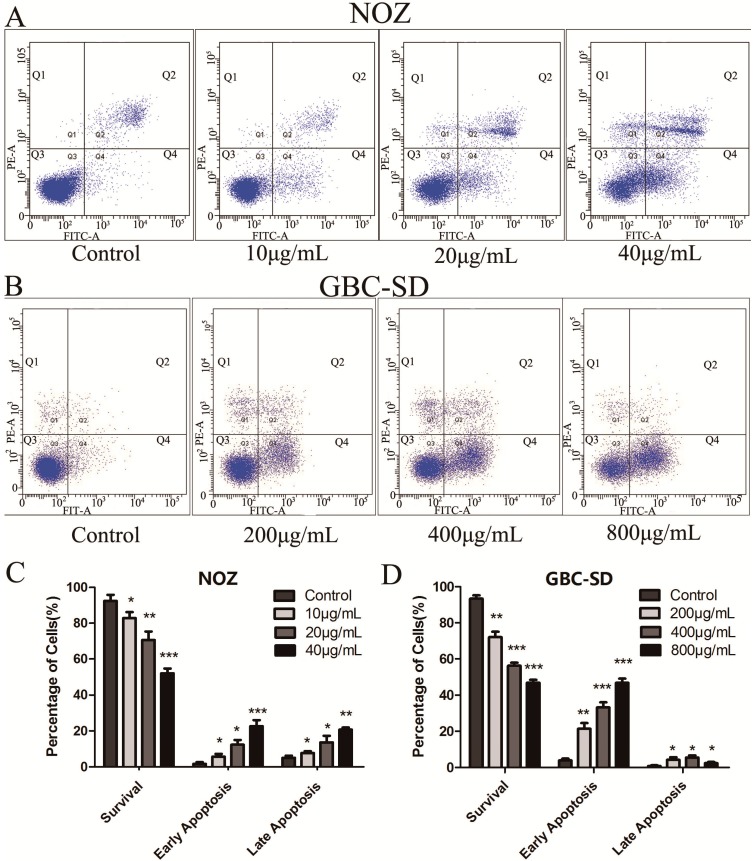
Figure 4.
Cordycepin induces the apoptosis of human gallbladder cancer cells.
(A,B) NOZ and GBC-SD cells were exposed to different concentrations of cordycepin for 48 h, followed by staining with Annexin-V/PI. The Q3 quadrant (Annexin V−/PI−), Q4 quadrant (Annexin V+/PI−) and Q2 quadrant (Annexin V+/PI+) represent the percentage of non-apoptotic cells, early apoptotic and late apoptotic cells, respectively. (C,D) Compared with the control group, the ratios of non-apoptotic cells, early apoptotic cells and late apoptotic cells are shown. The data represent the mean ± SD of three independent experiments. * p < 0.05, ** p < 0.01, *** p < 0.001 compared with the control.

