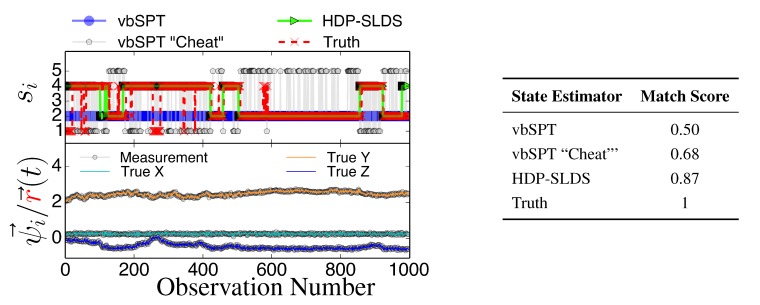
Figure 3.
State estimates for three different state estimators (see text for description) along with the true state sequence (top panel), the 3D trajectory showing unobservable position and observable position (bottom panel), and the table quantifying the performance of the state estimators through the “Match Score”, which is defined as one minus the average Hamming distance for the trajectory.

