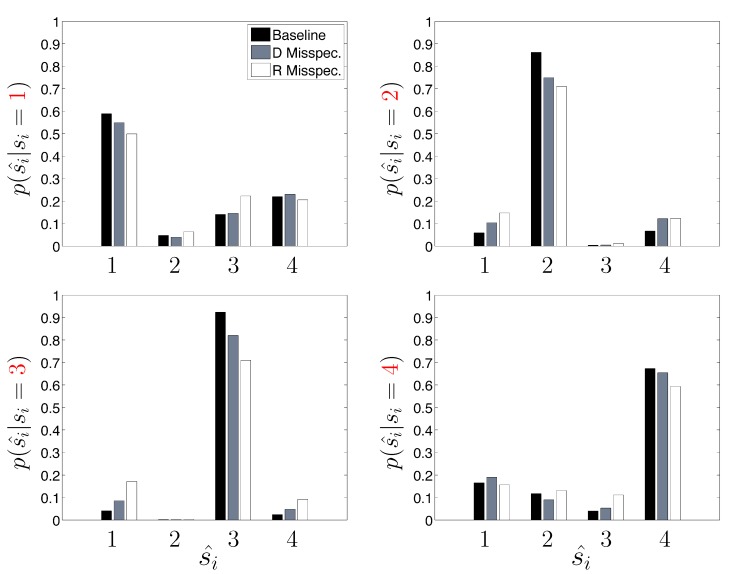
Figure 5.
A finer breakdown of the HDP-SLDS performance as a function of the known underlying state for three different conditions studied in Table 1. The y-axis shows the empirical conditional probability of the state estimate ŝi (x-axis) conditioned on the true (known) underlying state si (the panels vary over the four truth states used by the simulated data generating process).

