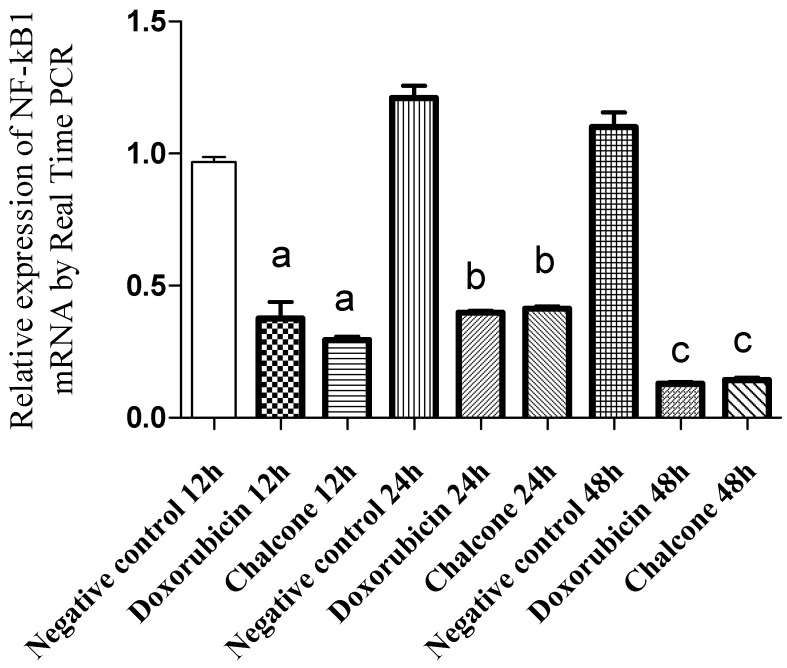
Figure 3.
Relative expression of NF-kB1 mRNA in PC-3 cells treated with cardamonin, measured by qRTPCR. Doxorubicin was used as a positive control. Values are the mean ± SD (n = 5). a = p < 0.05, ANOVA followed by the Tukey test, compared with the negative control at 12 h. b = p < 0.05, ANOVA followed by the Tukey test, compared with the negative control at 24 h. c = p < 0.05, ANOVA followed by the Tukey test, compared with the negative control at 48 h.

