Abstract
Long noncoding RNAs (lncRNA) are reported to be potential cancer biomarkers. This study aims to find new lncRNA biomarker relevant to lung adenocarcinoma. Gene expression profile and clinical data of lung adenocarcinoma and lung squamous cell carcinoma patients were downloaded from the UCSC Xena database. These data were analyzed to identify potential lncRNA prognostic biomarkers, and the candidate lncRNAs were analyzed and verified with association analysis, meta‐analysis, survival analysis, gene ontology analysis, gene set enrichment analysis, and other statistical methods. A group of 5 lncRNAs was identified from the 1965 differentially expressed (fold‐change >2) genes. Four of these 5 lncRNAs were expressed at a lower level in lung adenocarcinoma tissues and the other one at a higher level (P < .0001). A risk score model was constructed using a linear combination of the expression levels of these lncRNAs. High‐risk patients showed poorer overall survival (hazard ratio [HR] = 2.14; 95% confidence interval [CI], 1.67‐3.06, P < .0001), disease‐free survival (HR = 1.84; 95% CI, 1.26‐2.35, P = .0007), and recurrence‐free survival (HR = 1.51; 95% CI, 1.02‐2.40, P = .04). The 5‐fold cross‐validation and subsequent meta‐analysis further verified that patients in the low‐risk group had better survival (95% CI, 0.74‐1.79, Z = 4.72, P < .00001). Furthermore, both univariate and multivariate Cox regression analyses revealed that the prognostic value of these 5 lncRNAs was independent of other clinical prognostic factors. Further analysis indicated that these 5 lncRNAs might be associated with tumor metastasis. Taken together, our study suggests new prognostic lncRNA biomarkers for lung adenocarcinoma.
Keywords: adenocarcinoma of lung, long noncoding RNA, prognosis, survival, tumor biomarker
Abbreviations
- CI
confidence interval
- GO
gene ontology
- GSEA
gene set enrichment analysis
- HR
hazard ratio
- lncRNA
long noncoding RNA
- ncRNA
noncoding RNA
- TCGA
The Cancer Genome Atlas
1. INTRODUCTION
Lung cancer is one of the most common and life‐threatening cancers worldwide.1 In fact, the 5‐year survival rate of lung cancer patients is only 10%‐15% due to late diagnosis and the limitations of conventional treatments.2, 3 The molecular characterization of lung cancer is becoming essential for pathological diagnosis, treatment decisions, and prognosis estimation. Approximately 85% of lung cancer is non‐small‐cell lung cancer (NSCLC), and approximately 50% of NSCLC is lung adenocarcinoma. Therefore, we focused on lung adenocarcinoma in this study. Some lung adenocarcinoma patients show EML4‐ALK rearrangement, KRAS (KRAS proto‐oncogene, GTPase) mutations, and epidermal growth factor receptor (EGFR) overexpression or mutations,4, 5, 6, 7 and these alterations have been used as biomarkers in lung cancer patients. However, only a small percentage of patients show these abnormalities. Thus, more lung adenocarcinoma biomarkers are needed.
Protein molecules are common biomarkers; however, protein‐coding genes constitute <2% of the mammalian genome, and more than 80% of genes produce ncRNAs.8 Long lncRNAs are a class of ncRNAs longer than 200 nucleotides.9 Although the biological functions of most lncRNAs have not been characterized, there is increasing evidence that they play important roles in physiological and pathological processes, such as regulating cancer metastasis.10, 11, 12, 13, 14, 15 Long ncRNAs have been reported to act as potential biomarkers that have predictive value for the survival of cancer patients. For example, prostate cancer antigen 3 (PCA3) is considered to be an important biomarker in prostate cancer.16, 17 Additionally, metastasis‐associated lung adenocarcinoma transcript 1 (MALAT‐1) and colon cancer‐associated transcript 2 (CCAT2) have been reported to act as biomarkers in lung cancer patients.18, 19, 20 In this study, we aimed to find and validate new lncRNAs that can serve as prognostic biomarkers in lung adenocarcinoma patients.
2. MATERIALS AND METHODS
2.1. Datasets
The gene expression profile data of lung adenocarcinoma and lung squamous cell carcinoma patients were downloaded from the UCSC Xena database (http://xena.ucsc.edu/). The corresponding clinical information was retrieved from TCGA database.21 Tissues without expression or clinical survival information were removed from the analysis. The UCSC Xena website offers tools for the visualization and exploration of TCGA genomic data.
2.2. Hierarchical clustering
Information regarding LOC723809 (LHFPL3‐AS2), LOC150622 (LINC01105), NCRNA00092 (LINC00092), LOC284276 (LINC00908), and LOC100131726 (FAM83A‐AS1) expression in lung adenocarcinoma tissues was downloaded and normalized using a Z score analysis. Hierarchical clustering was carried out using R package gplots.22
2.3. Gene ontology analysis
Gene co‐expression with these 5 lncRNAs was defined by Pearson's correlation coefficient for the correlation between the expression of genes and these 5 lncRNAs. Pearson's correlation coefficient was calculated using the cor function in R. Genes with absolute coefficients higher than 0.3 were selected for a functional enrichment analysis using the DAVID Bioinformatics Tool (https://david.ncifcrf.gov/).23 Gene ontology functional clusters with P < .05 were considered to indicate potential biological functions of these lncRNAs.
2.4. Gene co‐expression network
Gene co‐expression networks were established to study the relationships between these 5 lncRNAs. Pearson's correlation coefficients of the lncRNA expression profiles were calculated. The network was completed using Cytoscape software.24 In the gene coexpression networks, genes were connected by edge.
2.5. Association analysis
High and low lncRNA expression was determined based on the median patient expression level. Associations were analyzed using the apriori function in the arules package in R.25, 26 The subset function was used to select rules connected to survival status or lymph node status. The results of the association analysis were visualized by the arulesViz package in R.27
2.6. Meta‐analysis of survival datasets
The meta‐analysis was carried out using Review Manager Version 5.3 (2014; The Nordic Cochrane Centre, The Cochrane Collaboration, Copenhagen, Denmark). The HR with a 95% CI in a fixed model was used to analyze the correlation between survival and risk score level. The significance of the pooled HR was determined through a Z test with a threshold of P < .05. A heterogeneity analysis was carried out using the I 2 statistic and χ2 test, and the combination of I 2 > 50% plus a χ2 test P value < .1 was defined as heterogeneity across the studies. No heterogeneity was observed in our study; therefore, the pooled HR estimates were calculated using the fixed‐effects model.
2.7. Survival analysis
The relationship between lncRNA expression and patient survival was assessed by Cox regression analysis using the coxph function of the R statistical software. A risk score model was built using a linear combination of the expression levels of the 5 lncRNAs with weighted coefficients. The patients were divided into low‐risk and high‐risk groups according to the best cut‐off value of the risk score. Patients with risk scores equal to or less than the best cut‐off value were defined as low‐risk patients, while those with risk scores higher than the best cut‐off value were defined as high‐risk patients. Kaplan‐Meier survival and log‐rank tests were undertaken to assess the differences between these two groups.
2.8. Gene set enrichment analysis
The potential biological pathways of the identified lncRNAs were analyzed using GSEA version 2.2.0 software.28 All patient risk scores were calculated according to the expression pattern of the lncRNAs. The patients were then divided into two groups based on the median risk score. Patients with an expression level above the median formed part of the high‐risk group (N = 127), and those with an expression level equal to or less than the median were defined as the low‐risk group (N = 128). The gene sets were analyzed using h.all.v5.1.symbols.gmt downloaded from MSigDB (http://software.broadinstitute.org/gsea/msigdb/download_file.jsp?filePath=/resources/msigdb/5.1/h.all.v5.1.symbols.gmt). One thousand permutations of each gene set were used.
2.9. Statistical analyses
A Mann‐Whitney U analysis was applied to compare the expression levels of lncRNAs between normal and adenocarcinoma lung tissues. The log‐rank test was used to compare the survival rate between two groups. The χ2 test was used to compare the death status, survival time, and tumor stage between two groups. A P value <0.05 was considered to indicate statistical significance.
3. RESULTS
3.1. Identification of a group of lncRNAs associated with survival of lung adenocarcinoma patients
To identify potential lncRNA biomarkers, we analyzed the lung adenocarcinoma patients in TCGA cohort. We first compared gene expression between normal (N = 58) and adenocarcinoma (N = 513) lung tissues and identified 1,965 genes (fold‐change >2) showing differential expression between the two groups. To identify a group of associated lncRNAs, we analyzed the relationships between the lncRNAs within these 1,965 genes. A Pearson correlation coefficient with an absolute value larger than 0.3 was considered to indicate a correlation. This analysis identified 5 lncRNAs, and we further investigated the relationships between these genes by constructing a gene coexpression network. The expression of LOC100131726 (FAM83A‐AS1) was negatively correlated with that of LOC723809 (LHFPL3‐AS2), whereas the expression levels of LOC723809 (LHFPL3‐AS2), LOC150622 (LINC01105), LOC284736 (LINC00908), and NCRNA00092 (LINC00092) were positively correlated with each other (Figure 1A). An association analysis was performed to confirm this result, and the results showed that the expression of these 5 lncRNAs formed 2 independent clusters (Figure 1B). Four of the lncRNAs (LOC723809 [LHFPL3‐AS2], LOC150622 [LINC01105], NCRNA00092 [LINC00092], and LOC284276 [LINC00908]) were expressed at a lower level and one (LOC100131726 [FAM83A‐AS1]) was overexpressed in adenocarcinoma tissues (P < .0001; Figure 1C). To further confirm our results, hierarchical clustering was used to analyze the systematic variations of these 5 lncRNAs in the same samples. It is clear from Figure 1D that the expression pattern of LOC100131726 (FAM83A‐AS1) is different from the other 4 lncRNAs. Finally, the alterations in their DNA copy number were investigated in 7,589 adenocarcinoma samples.29 The LOC723809 (LHFPL3‐AS2) and LOC150622 (LINC01105) genomic loci were not frequently lost. The NCRNA00092 (LINC00092) locus was deleted in 10%‐15% of the patients, whereas the LOC284276 (LINC00908) locus was deleted in 30%‐45% of the samples, and LOC100131726 (FAM83A‐AS1) was amplified in 30%‐40% of the patients (Figure 1E).
Figure 1.
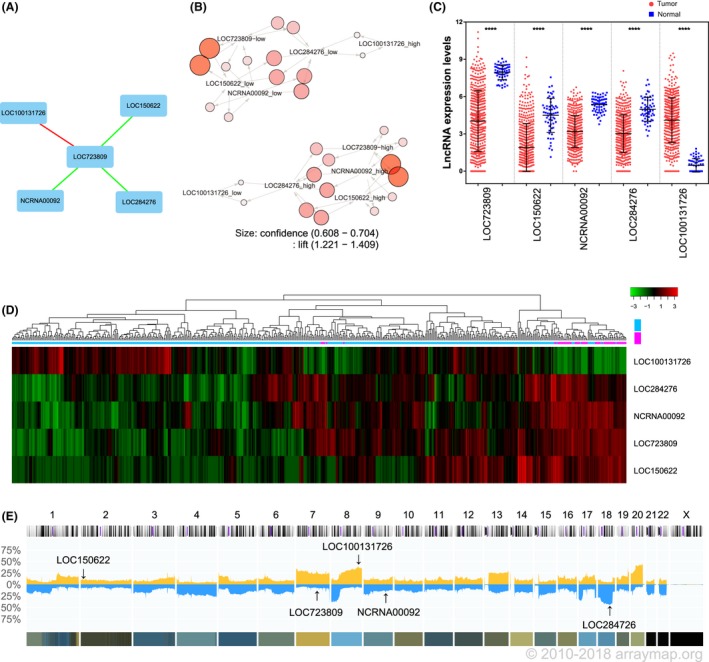
Association of long noncoding RNAs (lncRNAs) with lung adenocarcinoma. A, Gene expression network of 5 lncRNAs in lung adenocarcinoma tissues. Green lines indicate genes that are positively correlated with each other; red lines indicate negative correlations. B, Association analysis of the expression of these 5 lncRNAs. The lift value is shown by the color intensity, and the size of each circle indicates the confidence value. C, Mann‐Whitney U analysis comparing the expression levels of the 5 lncRNAs between normal lung (blue squares; N = 58) and lung adenocarcinoma (red circles; N = 513) tissues. D, Heat map of the lncRNA expression levels in normal lung and lung adenocarcinoma tissues. E, DNA copy number alterations across all chromosomes in 7,589 adenocarcinoma samples (Progenetix histoplot). Blue indicates DNA deletion; yellow indicates DNA amplification
3.2. Analysis of the prognostic value of these lncRNAs in lung adenocarcinoma patients
After identifying a group of lncRNAs showing differential expression in lung adenocarcinoma, we examined whether their expression was associated with prognosis in lung adenocarcinoma patients. A risk score model was constructed using a linear combination of the expression levels of these 5 lncRNAs with weighted coefficients. A time‐dependent receiver operating characteristic curve was determined to evaluate the optimal cut‐off value. Patients with a risk score equal to or less than 0.258 were defined as low‐risk patients, whereas those with a score >0.258 were defined as high‐risk patients. A Kaplan‐Meier survival curve was plotted to compare the overall survival difference between these 2 groups (Figure 2A, N = 502). The same method was used to analyze the relationships between this group of lncRNAs and disease‐free (Figure 2B, N = 428) or recurrence‐free survival (Figure 2C, N = 351). High‐risk patients showed poor overall survival (HR = 2.14; 95% CI, 1.67‐3.06, P < .0001), disease‐free survival (HR = 1.84; 95% CI, 1.26‐2.35, P = .0007), and recurrence‐free survival (HR = 1.51; 95% CI, 1.02‐2.40, P = .04). We then investigated the relationship between the risk score and clinicopathological factors in the same cohort and found that the lymph node status (P < .0001), tumor grade (P = .016), tumor stage (P < .0001), and smoking status (P = .008), but not gender or tumor size, were correlated with the risk score (Table 1).
Figure 2.
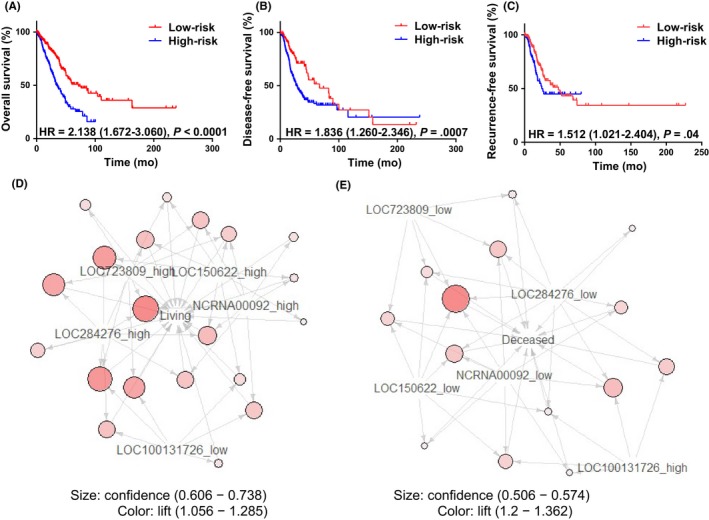
Overall survival, recurrence‐free survival, and disease‐free survival in relation to long non‐coding RNA (lncRNA) expression levels. A‐C, Kaplan‐Meier survival curves comparing overall survival (A, N = 502), disease‐free survival (B, N = 428), and recurrence‐free survival (C, N = 351) between low‐ and high‐risk lung adenocarcinoma patients. D,E, Association between the expression of these 5 lncRNAs and a survival status of living (D) or deceased (E). HR, hazard ratio
Table 1.
Associations of risk score with clinicopathological factors of patients with lung adenocarcinoma or lung squamous cell carcinoma
| Patient features | Sample size | High risk, N (%) | Low risk, N (%) | P value | |
|---|---|---|---|---|---|
| Lymph node | Negative | 327 | 145 (29.06) | 182 (36.47) | <.0001 |
| Positive | 172 | 107 (21.44) | 65 (13.03) | ||
| NA | 12 | ||||
| Tumor grade | T1 | 168 | 67 (13.19) | 101 (19.88) | .016 |
| T2 | 275 | 151 (29.72) | 124 (24.41) | ||
| T3 | 46 | 25 (4.92) | 21 (4.13) | ||
| T4 | 19 | 11 (2.17) | 8 (1.57) | ||
| NA | 3 | ||||
| Age, years | ≤65 | 235 | 126 (25.66) | 109 (22.20) | .114 |
| >65 | 256 | 119 (24.24) | 137 (27.90) | ||
| NA | 20 | ||||
| Smoking | Non‐smoking | 75 | 27 (5.44) | 48 (9.68) | .008 |
| Smoking | 421 | 221 (44.56) | 200 (40.32) | ||
| NA | 15 | ||||
| Gender | Female | 274 | 137 (26.86) | 137 (26.86) | 1.000 |
| Male | 236 | 118 (23.14) | 118 (23.14) | ||
| NA | 1 | ||||
| Tumor size | ≤1 cm | 171 | 81 (22.13) | 90 (24.59) | .722 |
| >1 cm | 195 | 96 (26.23) | 99 (27.05) | ||
| NA | 145 | ||||
| Tumor stage | Stage I | 278 | 120 (23.58) | 158 (31.04) | <.0001 |
| Stage II | 121 | 64 (12.57) | 57 (11.20) | ||
| Stage III | 84 | 59 (11.59) | 25 (4.91) | ||
| Stage IV | 26 | 12 (2.36) | 14 (2.75) | ||
| NA | 2 | ||||
NA, not available.
To further confirm our results, an association analysis was carried out to examine the correlation between survival status and lncRNA expression, using the arules package of R. Twenty rules were identified in the live patients. Here, rules means the association relationships between the expression of lncRNAs and survival status. Low LOC100131726 (FAM83A‐AS1) expression and high LOC723809 (LHFPL3‐AS2), LOC150622 (LINC01105), NCRNA00092 (LINC00092), and LOC284276 (LINC00908) expression were associated with survival (Figure 2D). Fourteen rules were found in the deceased patients. High LOC100131726 (FAM83A‐AS1) expression and low LOC723809 (LHFPL3‐AS2), LOC150622 (LINC01105), NCRNA00092 (LINC00092), and LOC284276 (LINC00908) expression were associated with death (Figure 2E).
3.3. Validation of the prognostic value of these lncRNAs in lung adenocarcinoma
We used 5‐fold cross‐validation to validate the prognostic value of these 5 lncRNAs. The same cohort of lung adenocarcinoma patients as in the previous section (N = 502) were randomly divided into 5 groups of approximately equal number of samples (N1 = N2 = 101, N3 = N4 = N5 = 100). One of the 5 samples was used as the validation data and the remaining four samples as training data. This process was repeated 5 times, with each of the 5 samples used exactly once as the validation data. We then used the same method as in the previous section to generate a risk model for comparing overall survival between low‐risk and high‐risk patients. Three of the 5 groups of patients showed a significantly different overall survival rate between the two risk groups (Figure 3A). A fixed‐effects meta‐analysis was undertaken to study the comprehensive HR of these 5 groups, and an aggregated HR = of 1.26 (95% CI, 0.74‐1.79, Z = 4.72, P < .00001) suggested that low risk was better for survival (Figure 3B).
Figure 3.
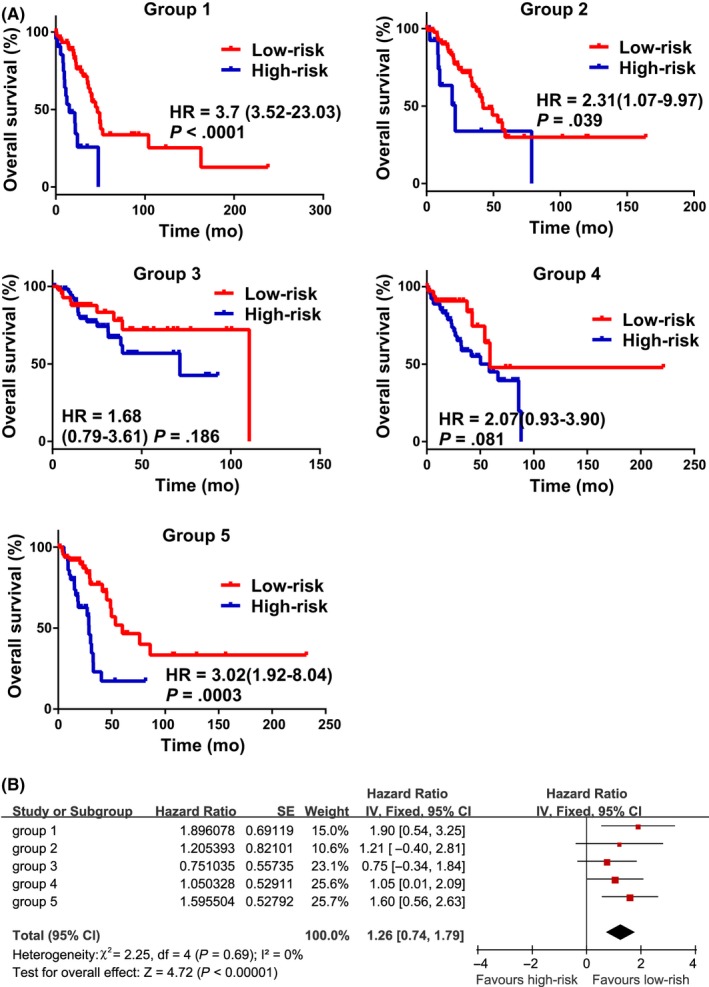
Validation of the prognostic value of this group of long non‐coding RNAs (lncRNAs) in lung adenocarcinoma. A, Kaplan‐Meier survival curves comparing overall survival between low‐ and high‐risk patients in different groups. B, Meta‐analysis estimating the association between risk score levels and prognosis in 5 groups of patients. The series ID, combined hazard ratio (HR) with 95% confidence interval, and SE of the HR are shown. The generic inverse variance data type, inverse variance method, and fixed‐effects model were used to perform this estimation
To further confirm the prognostic value of these 5 lncRNAs, we investigated the relationship between the expression of each lncRNA and cancer risk in 255 lung adenocarcinoma patients (ID: Lung Adenocarcinoma TCGA) included in the SurvExpress database and found that high LOC100131726 (FAM83A‐AS1) expression and low LOC723809 (LHFPL3‐AS2), LOC150622 (LINC01105), NCRNA00092 (LINC00092), and LOC284276 (LINC00908) expression were correlated with poor survival (Figure 4A). The distribution of risk scores, death status, survival time, tumor stage, and expression pattern of the 5 lncRNAs is shown in Figure 4B. High‐ and low‐risk scores were found to be highly correlated with patient status (P = .002, χ2 test), survival time (P = .002, χ2 test), and tumor stage (P = .023, χ2 test). Most of the advanced stage patients were in the high‐risk group. A hierarchical clustering analysis revealed that the expression pattern of this group of lncRNAs was significantly correlated with tumor risk. Moreover, all of the patients in the high‐risk group showed poor survival outcomes, with an HR of 3.01 (95% CI, 1.85‐4.88, P = 8.25e‐06) (Figure 4C). Even in an analysis of the 80 patients who died, the high‐risk group showed poorer survival outcomes than the low‐risk group, with an HR of 3.02 (Figure 4D).
Figure 4.
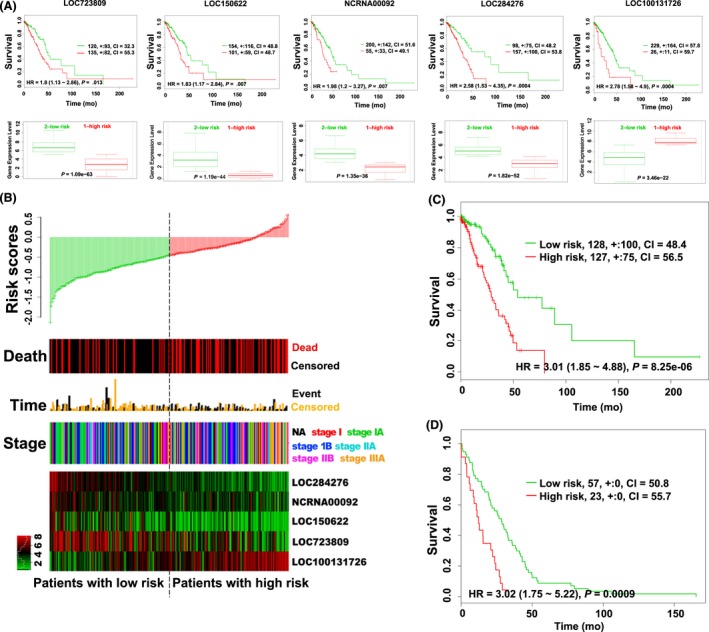
Prognostic value of long non‐coding RNAs (lncRNAs) in lung adenocarcinoma patients. A, Top panels: Kaplan‐Meier survival curves of lung adenocarcinoma patients. The patients were stratified by risk group using the SurvExpress database. Bottom panels: expression of lncRNAs in the two groups of patients, high‐risk (red lines) and low‐risk (green lines). B, Distribution of risk scores, survival status, survival times, tumor stage, and expression patterns of this group of lncRNAs in lung adenocarcinoma (SurvExpress). C,D, Kaplan‐Meier survival curves between all lung adenocarcinoma patients (C) and 80 deceased patients (D) at low and high risk according to the expression pattern of this group of lncRNAs (SurvExpress). CI, confidence interval; NA, not available
3.4. Independence of the prognostic value of these lncRNAs
To investigate whether the predictive capacity of this group of lncRNAs was independent of other clinical factors, such as age, gender, tumor grade, smoking, and lymph node status, we undertook univariate and multivariate Cox regression analyses. The univariate analysis showed that these 5 lncRNAs (HR = 2.718, 95% CI, 1.810‐4.081, P = 1.4e‐06), lymph node status (HR = 1.754, 95% CI, 1.450‐2.121, P = 5.1e‐08), and tumor stage (HR = 1.717, 95% CI, 1.451‐2.031, P = 3e‐10) were significantly associated with survival. The multivariate analysis revealed that these 5 lncRNAs (HR = 2.662, 95% CI, 1.716‐4.128, P = 1.2e‐05), age (HR = 1.024, 95% CI, 1.006‐1.043, P = .0092), and tumor stage (HR = 1.551, 95% CI, 1.222‐1.967, P = .0003) were independent prognostic factors (Table 2).
Table 2.
Univariable and multivariable Cox regression analysis of overall survival in lung adenocarcinoma patients (N = 366)
| Variable | Univariable analysis | Multivariable analysis | ||||
|---|---|---|---|---|---|---|
| HR | 95% CI of HR | P value | HR | 95% CI of HR | P value | |
| Five lncRNAs | 2.718 | 1.810‐4.081 | 1.4e‐06 | 2.662 | 1.716‐4.128 | 1.2e‐05 |
| Lymph node | 1.754 | 1.450‐2.121 | 5.1e‐08 | 1.164 | 0.890‐1.522 | .2672 |
| Age | 1.012 | 0.994‐1.030 | 0.18 | 1.024 | 1.006‐1.043 | .0092 |
| Smoking | 1.010 | 0.846‐1.206 | 0.91 | 1.021 | 0.847‐1.232 | .8249 |
| Gender | 1.093 | 0.774‐1.542 | 0.61 | 1.076 | 0.753‐1.537 | .6880 |
| Tumor stage | 1.717 | 1.451‐2.031 | 3e‐10 | 1.551 | 1.222‐1.967 | .0003 |
CI, confidence interval; HR, hazard ratio; lncRNA, long noncoding RNA.
We further classified the patients into subgroups according to their tumor stage, tumor size, smoking history, and lymph node status. Patients at tumor stages I and II were defined as early stage, and those at stages III and IV were classified as advanced stage. The patients in the early and advanced stage group were further stratified into low‐risk and high‐risk subgroups based on their risk score. Patients in low‐ and high‐risk groups showed significantly different overall survival (P < .0001) (Figure 5A). The high‐risk patients in the advanced‐stage group showed poor survival, with an HR of 1.88 (Figure 5B). In patients with tumors in which the longest dimension was longer or shorter than 1 cm, lymph node‐negative or lymph node‐positive patients, and smoking or non‐smoking patients, this group of lncRNAs showed similar prognostic value (P < .05; Figure 5C‐H).
Figure 5.
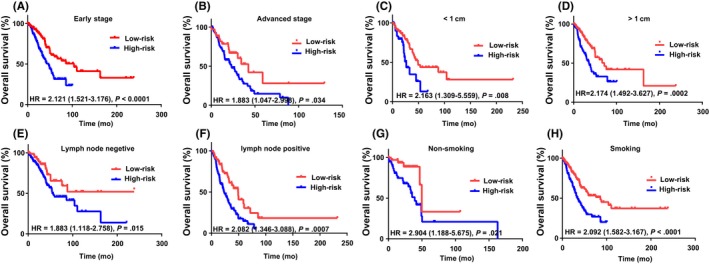
Survival curves of patients with different risk scores classified by clinical factors. Kaplan‐Meier survival curves of patients with early (A) and advanced (B) tumor stage, patients with tumors in which the longest dimension was less (C) and greater (D) than 1 cm, patients without (E) and with (F) lymph node metastasis, and non‐smoking (G) and smoking (H) patients. HR, hazard ratio
3.5. Evaluation of the prognostic value of these lncRNAs in lung squamous cell carcinoma patients
We wondered whether this group of lncRNAs, which were identified as a valuable prognostic marker in adenocarcinoma patients, would also have prognostic value in other types of lung cancer. Thus, we assessed lung squamous cell carcinoma patients using the SurvExpress database (ID: Lung Squamous Cell Carcinoma TCGA). The relationship between the expression of each lncRNA and survival time was examined. In contrast to the finding in lung adenocarcinoma patients, LOC723809 (LHFPL3‐AS2) and LOC284276 (LINC00908) were not associated with survival in lung squamous cell carcinoma patients (P > .05; Figure 6A). However, low LOC150622 (LINC01105) and NCRNA00092 (LINC00092) expression increased the risk of death, and low LOC100131726 (FAM83A‐AS1) expression was associated with a low risk of death. Although LOC723809 (LHFPL3‐AS2) and LOC284276 (LINC00908) showed no differences in expression between low‐ and high‐risk patients, a Cox regression analysis indicated that the overall expression pattern of all 5 lncRNAs as a group (Figure 6B) is still a better prognostic marker of lung squamous cell carcinoma than the expression pattern of only the three lncRNAs that showed differential expression between the different risk groups (Figure 6C). It is possible that we did not observe differential LOC723809 (LHFPL3‐AS2) and LOC284276 (LINC00908) expression between the low‐ and high‐risk patients because the number of patients was too low. However, the use of the combination of these 5 lncRNAs as a prognostic marker in lung squamous cell carcinoma requires further analysis.
Figure 6.
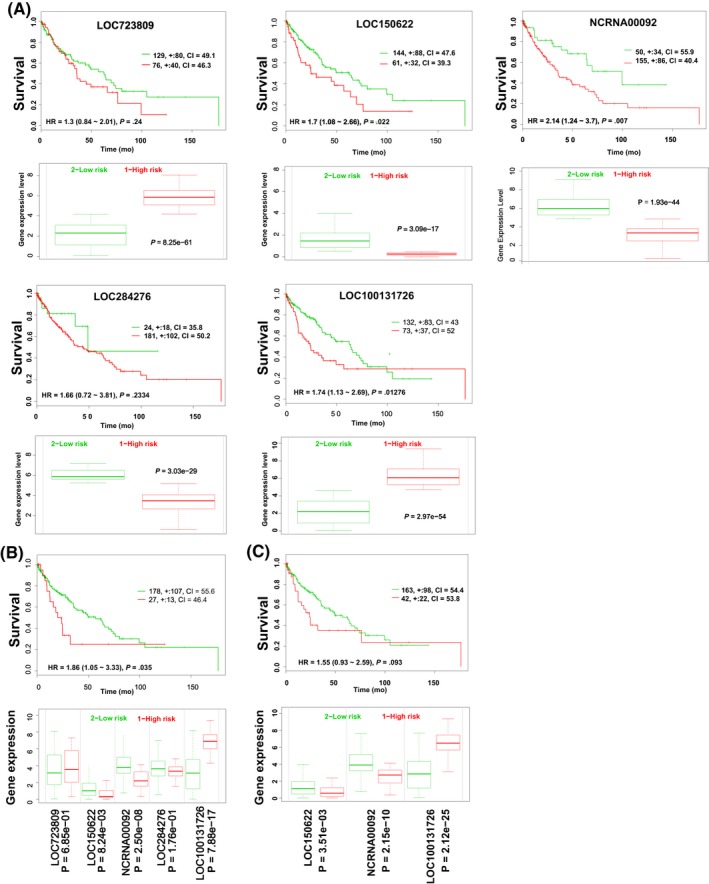
Relationship between long non‐coding RNAs (lncRNAs) and survival in lung squamous cell carcinoma. Upper panels: Kaplan‐Meier survival curves of lung squamous cell carcinoma patients. The patients were stratified by risk group based on each lncRNA (A), all 5 lncRNAs (B), and three lncRNAs (C) using the SurvExpress database. Lower panels: gene expression stratified by risk group using SurvExpress. Red lines, patients at high risk; green lines, patients at low risk. CI, confidence interval; HR, hazard ratio
3.6. Association of these lncRNAs with tumor metastasis
To study the biological pathways of these lncRNAs, each patient's risk score was calculated, and the patients were then stratified into high‐ and low‐risk groups according to their median risk score. A GSEA revealed that the genes involved in the epithelial‐mesenchymal transition pathway were enriched in the high‐risk group (Figure 7A), which suggested that these lncRNAs might be involved in metastasis‐related pathways. We undertook a GO functional enrichment analysis to confirm this potential function. Pearson's correlation coefficients between the expression of various genes and these 5 lncRNAs were calculated. The genes with an absolute correlation coefficient value higher than 0.3 were selected for GO analysis. Genes involved in cell‐cell adherens junctions were enriched (Figure 7B), and we then compared the expression profiles of these genes between patients with positive and negative lymph node statuses. Four of the lncRNAs (LOC723809 [LHFPL3‐AS2], LOC150622 [LINC01105], NCRNA00092 [LINC00092], and LOC284276 [LINC00908]) were expressed at significantly lower levels in the lymph node‐positive group than in the lymph node‐negative group (Figure 7C). An association analysis was also undertaken to confirm that the expression of these lncRNAs was associated with lymph node metastasis status. Twenty‐two rules demonstrated that high LOC100131726 (FAM83A‐AS1) expression and low LOC723809 (LHFPL3‐AS2), LOC150622 (LINC01105), NCRNA00092 (LINC00092), and LOC284276 (LINC00908) expression were associated with the occurrence of lymph node metastasis (Figure 7D). Thirteen rules revealed that the opposite expression patterns were associated with a lymph node‐negative status (Figure 7E). Here, “rules” means the association relationships between the expression of lncRNAs and the status of lymph node metastasis that was learned by the association rule‐learning algorithm.
Figure 7.
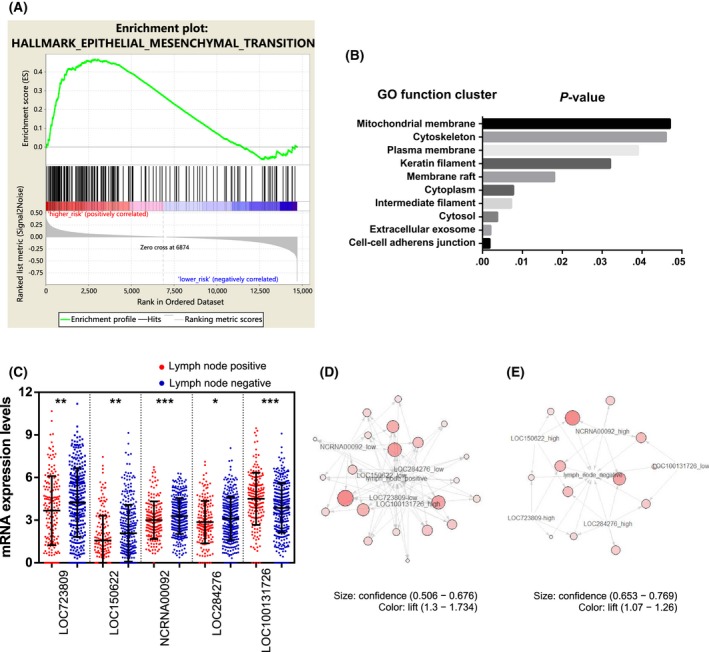
Association between long non‐coding RNAs (lncRNAs) and tumor metastasis in lung adenocarcinoma patients. A, Gene set enrichment analysis enrichment score curves showing the relationship between the epithelial‐mesenchymal transition (EMT) pathway and the risk of lung adenocarcinoma (N = 255). Top panel: X‐axis indicates genes with high expression in the high‐risk (left end) and low‐risk (right end) patients. The green curve indicates the enrichment score. The positive enrichment score at the high‐risk end indicates upregulation of the EMT pathway in the high‐risk samples. Middle panel: black lines indicate genes expressed in the EMT pathway. Bottom panel: Gene list ordered by ranking metric. Positive value indicates correlation with high risk and negative value indicates correlation with low risk. B, Gene Ontology function cluster analysis of the genes coexpressed with these 5 lncRNAs. C, Expression profiles of these 5 lncRNAs in lymph node‐positive and lymph node‐negative lung adenocarcinoma patients. D,E, Connection between the expression of these 5 lncRNAs and a positive (red circles) (D) or negative (blue squares) (E) lymph node metastasis status. The lift value is shown by the color intensity and the size of the circle indicates the confidence value
4. DISCUSSION
Lung adenocarcinoma is often triggered by a class of aberrant genes. However, 30%‐50% of lung adenocarcinoma patients lack aberrations of the biomarker genes. Therefore, more sensitive biomarkers of lung adenocarcinoma are needed. Multigene expression signatures focusing on lncRNAs, miRNAs, and protein‐coding genes have been used for predicting risk and survival.30, 31, 32, 33, 34, 35, 36 In this study, we report the prognostic value of 5 lncRNAs (LOC723809 [LHFPL3‐AS2], LOC150622 [LINC01105], NCRNA00092 [LINC00092], LOC284276 [LINC00908], and LOC100131726 [FAM83A‐AS1]) in lung adenocarcinoma. LOC150622 (LINC01105) is a stage‐specific biomarker in lung adenocarcinoma. It is also highly expressed in neuroblastoma tissue, where it affects cellular proliferation and apoptosis.37, 38 Methylation of the LOC284276 (LINC00908) gene is negatively associated with birth weight.39 NCRNA00092 (LINC00092) acts in cancer‐associated fibroblasts to drive glycolysis and progression of ovarian cancer.40 No studies have investigated the biological functions of LOC723809 (LHFPL3‐AS2) or LOC100131726 (FAM83A‐AS1). The results of this study indicate that their expression is correlated with each other. In addition, 4 of these lncRNAs (LOC723809 [LHFPL3‐AS2], LOC150622 [LINC01105], NCRNA00092 [LINC00092], and LOC284276 [LINC00908]) are expressed at low levels, whereas LOC100131726 (FAM83A‐AS1) is expressed at a high level in lung adenocarcinoma tissue. The abnormal expression of these 5 lncRNAs is related to patient survival and tumor metastasis. Moreover, their expression signature might independently predict survival in lung adenocarcinoma patients.
In lung adenocarcinoma, abnormal expression of this group of lncRNAs was found to be associated with poor prognosis. Hierarchical clustering also revealed that the expression pattern of this group of lncRNAs was significantly correlated with survival. The risk score model also revealed a correlation between the expression of this group of lncRNAs and overall survival, disease‐free survival, and recurrence‐free survival. Moreover, we found that the expression levels of these lncRNAs were associated with each other in lung adenocarcinoma. The expression of the 4 positively associated lncRNAs might be regulated by the same mechanism or they might positively regulate each other's expression. In addition, LOC723809 (LHFPL3‐AS2) and LOC100131726 (FAM83A‐AS1) might negatively regulate each other. Finally, both univariate and multivariate Cox regression analyses indicated that this group of lncRNAs was independent of other clinicopathological risk factors. Overall, multiple lines of evidence showed the prognostic value of this group of lncRNAs in assessing the risk of lung adenocarcinoma.
A Cox regression analysis indicated that tumor stage was an independent clinicopathological factor for predicting the risk of lung adenocarcinoma. This finding is consistent with those of previous studies, which reported that approximately 70% of lung adenocarcinoma patients show locally advanced (stage IIIB) or metastatic disease (stage IV). The 5‐year survival rate of stage IIIB and IV patients is 7% and 2%, respectively.41, 42 However, a survival rate higher than 80% is achieved with lung resection at an early stage of disease.43 Although cigarette smoking is the major cause of lung cancer, both univariate and multivariate Cox regression analyses revealed that cigarette smoking was not correlated with survival, which agrees with previous reports.7, 44, 45
Both GSEA and GO function cluster analyses found that genes involved in the epithelial‐mesenchymal transition and cell‐cell adherens junction were associated with this group of lncRNAs. A correlation analysis between their expression and the lymph node metastasis status also revealed that high LOC100131726 (FAM83A‐AS1) expression and low LOC723809 (LHFPL3‐AS2), LOC150622 (LINC01105), NCRNA00092 (LINC00092), and LOC284276 (LINC00908) expression were associated with lymph node positivity. This result was consistent with the survival status or poor prognosis. Thus, the regulation of tumor metastasis might be a mechanism through which this group of lncRNAs affects survival. In conclusion, we have established the prognostic value of a group of lncRNAs showing abnormal expression levels in lung adenocarcinoma. These lncRNAs might not only predict prognosis but also provide a theoretical basis for molecularly targeted therapy in the future.
This study identified, by data mining, a group of lncRNAs that can act as a prognostic biomarker for lung adenocarcinoma patients, but it has its limitations. All the statistical and bioinformatic analyses in this study were carried out in silico. We did not undertake any wet laboratory experiments. We know through statistical methods that these 5 lncRNA are associated with the prognosis of lung adenocarcinoma patients, but we do not know the exact biological mechanism underlying this association. Whether or not and how these lncRNAs are tied to lung cancer proliferation, progression, or invasion needs to be investigated by elaborately designed wet laboratory experiments in the future. Another limitation of this study is that the risk score model was only validated with cross‐validation. In an ideal world, a predictive model should always be validated with independent data to overcome the overfitting problem. Unfortunately, it is currently difficult to find another independent lung adenocarcinoma cohort that is of comparable size within TCGA that has the necessary clinical data, so we had to use the same lung adenocarcinoma cohort from TCGA to both build and validate the risk score model. This is where cross‐validation comes in. By dividing the cohort into subgroups and using different groups to build and validate the model, the ability of the model to generalize to independent data can thus be assessed and the overfitting problem can be overcome.
CONFLICT OF INTEREST
The authors have no conflict of interest.
ACKNOWLEDGMENTS
This study was supported by the National Natural Science Foundation of China (grant no. 31571400) and the Basic Research Fund of Shenzhen (grant no. JCYJ20150724173156330).
Liao M, Liu Q, Li B, Liao W, Xie W, Zhang Y. A group of long noncoding RNAs identified by data mining can predict the prognosis of lung adenocarcinoma. Cancer Sci. 2018;109:4033–4044. 10.1111/cas.13822
Meijian Liao and Qing Liu contributed equally to this work.
Contributor Information
Weidong Xie, Email: xiewd@sz.tsinghua.edu.cn.
Yaou Zhang, Email: zhangyo@sz.tsinghua.edu.cn.
REFERENCES
- 1. Youlden DR, Cramb SM, Baade PD. The International Epidemiology of Lung Cancer: geographical distribution and secular trends. J Thorac Oncol. 2008;3:819‐831. [DOI] [PubMed] [Google Scholar]
- 2. Cagle PT, Allen TC, Dacic S, et al. Revolution in lung cancer: new challenges for the surgical pathologist. Arch Pathol Lab Med. 2011;135:110‐116. [DOI] [PubMed] [Google Scholar]
- 3. Cagle PT, Dacic S. Lung cancer and the future of pathology. Arch Pathol Lab Med. 2011;135:293‐295. [DOI] [PubMed] [Google Scholar]
- 4. Sobol RE, Astarita RW, Hofeditz C, et al. Epidermal growth factor receptor expression in human lung carcinomas defined by a monoclonal antibody. J Natl Cancer Inst. 1987;79:403‐407. [PubMed] [Google Scholar]
- 5. Soda M, Choi YL, Enomoto M, et al. Identification of the transforming EML4‐ALK fusion gene in non‐small‐cell lung cancer. Nature. 2007;448:561‐566. [DOI] [PubMed] [Google Scholar]
- 6. Togashi Y, Soda M, Sakata S, et al. KLC1‐ALK: a novel fusion in lung cancer identified using a formalin‐fixed paraffin‐embedded tissue only. PLoS ONE. 2012;7:e31323. [DOI] [PMC free article] [PubMed] [Google Scholar]
- 7. Saito M, Shiraishi K, Kunitoh H, Takenoshita S, Yokota J, Kohno T. Gene aberrations for precision medicine against lung adenocarcinoma. Cancer Sci. 2016;107:713‐720. [DOI] [PMC free article] [PubMed] [Google Scholar]
- 8. Carninci P, Kasukawa T, Katayama S, et al. The transcriptional landscape of the mammalian genome. Science. 2005;309:1559‐1563. [DOI] [PubMed] [Google Scholar]
- 9. Kapranov P, Cheng J, Dike S, et al. RNA maps reveal new RNA classes and a possible function for pervasive transcription. Science. 2007;316:1484‐1488. [DOI] [PubMed] [Google Scholar]
- 10. Lipovich L, Johnson R, Lin CY. MacroRNA underdogs in a microRNA world: evolutionary, regulatory, and biomedical significance of mammalian long non‐protein‐coding RNA. Biochem Biophys Acta. 2010;1799:597‐615. [DOI] [PubMed] [Google Scholar]
- 11. Niu DK, Jiang L. Can ENCODE tell us how much junk DNA we carry in our genome? Biochem Biophys Res Comm. 2013;430:1340‐1343. [DOI] [PubMed] [Google Scholar]
- 12. Ohno S. So much “junk” DNA in our genome. Brookhaven Symp Biol. 1972;23:366‐370. [PubMed] [Google Scholar]
- 13. Wang Z, Fan P, Zhao Y, et al. NEAT1 modulates herpes simplex virus‐1 replication by regulating viral gene transcription. Cell Mol Life Sci. 2017;74:1117‐1131. [DOI] [PMC free article] [PubMed] [Google Scholar]
- 14. Schmitt AM, Garcia JT, Hung T, et al. An inducible long noncoding RNA amplifies DNA damage signaling. Nat Genet. 2016;48:1370‐1376. [DOI] [PMC free article] [PubMed] [Google Scholar]
- 15. Chen X, Han H, Li Y, Zhang Q, Mo K, Chen S. Upregulation of long noncoding RNA HOTTIP promotes metastasis of esophageal squamous cell carcinoma via induction of EMT. Oncotarget. 2016;7:84480‐84485. [DOI] [PMC free article] [PubMed] [Google Scholar]
- 16. Bourdoumis A, Papatsoris AG, Chrisofos M, Efstathiou E, Skolarikos A, Deliveliotis C. The novel prostate cancer antigen 3 (PCA3) biomarker. Int Braz J Urol. 2010;36:665‐668; discussion 9. [DOI] [PubMed] [Google Scholar]
- 17. Laxman B, Morris DS, Yu J, et al. A first‐generation multiplex biomarker analysis of urine for the early detection of prostate cancer. Can Res. 2008;68:645‐649. [DOI] [PMC free article] [PubMed] [Google Scholar]
- 18. Schmidt LH, Spieker T, Koschmieder S, et al. The long noncoding MALAT‐1 RNA indicates a poor prognosis in non‐small cell lung cancer and induces migration and tumor growth. J Thorac Oncol. 2011;6:1984‐1992. [DOI] [PubMed] [Google Scholar]
- 19. Zhang X, Xu Y, He C, et al. Elevated expression of CCAT2 is associated with poor prognosis in esophageal squamous cell carcinoma. J Surg Oncol. 2015;111:834‐839. [DOI] [PubMed] [Google Scholar]
- 20. Shuai P, Zhou Y, Gong B, et al. Long noncoding RNA MALAT1 can serve as a valuable biomarker for prognosis and lymph node metastasis in various cancers: a meta‐analysis. SpringerPlus. 2016;5:1721. [DOI] [PMC free article] [PubMed] [Google Scholar]
- 21. Grossman RL, Heath AP, Ferretti V, et al. Toward a shared vision for cancer genomic data. N Engl J Med. 2016;375:1109‐1112. [DOI] [PMC free article] [PubMed] [Google Scholar]
- 22. Warnes GR, Bolker B, Bonebakker L, et al. gplots: various R programming tools for plotting data. R package version 3.0.1. 2016.3. http://CRAN.R-project.org/package=gplots. Accessed March 30, 2016.
- 23. Huang da W, Sherman BT, Lempicki RA. Bioinformatics enrichment tools: paths toward the comprehensive functional analysis of large gene lists. Nucleic Acids Res. 2009;37:1‐13. [DOI] [PMC free article] [PubMed] [Google Scholar]
- 24. Shannon P, Markiel A, Ozier O, et al. Cytoscape: a software environment for integrated models of biomolecular interaction networks. Genome Res. 2003;13:2498‐2504. [DOI] [PMC free article] [PubMed] [Google Scholar]
- 25. Hahsler M, Gr B, Hornik K. Introduction to arules – Mining Association Rules and Frequent Item Sets. SIGKDD Explor. 2007;2:1‐37. [Google Scholar]
- 26. Agrawal R, Srikant R. Fast algorithms for mining association rules. Proc 20th Int Conf VLDB. 1994;1215:487‐499. [Google Scholar]
- 27. Hahsler M, Chelluboina S. Visualizing association rules: introduction to the R‐extension Package arulesViz. Acta Orthop Scand. 2015;69:323‐325. [Google Scholar]
- 28. Subramanian A, Tamayo P, Mootha VK, et al. Gene set enrichment analysis: a knowledge‐based approach for interpreting genome‐wide expression profiles. Proc Natl Acad Sci USA. 2005;102:15545‐15550. [DOI] [PMC free article] [PubMed] [Google Scholar]
- 29. Cai H, Kumar N, Baudis M. arrayMap: a reference resource for genomic copy number imbalances in human malignancies. PLoS ONE. 2012;7:e36944. [DOI] [PMC free article] [PubMed] [Google Scholar]
- 30. Zhou M, Guo M, He D, et al. A potential signature of eight long non‐coding RNAs predicts survival in patients with non‐small cell lung cancer. J Transl Med. 2015;13:231. [DOI] [PMC free article] [PubMed] [Google Scholar]
- 31. Zhou M, Zhong L, Xu W, et al. Discovery of potential prognostic long non‐coding RNA biomarkers for predicting the risk of tumor recurrence of breast cancer patients. Sci Rep. 2016;6:31038. [DOI] [PMC free article] [PubMed] [Google Scholar]
- 32. Lossos IS, Czerwinski DK, Alizadeh AA, et al. Prediction of survival in diffuse large‐B‐cell lymphoma based on the expression of six genes. N Engl J Med. 2004;350:1828‐1837. [DOI] [PubMed] [Google Scholar]
- 33. Alizadeh AA, Gentles AJ, Alencar AJ, et al. Prediction of survival in diffuse large B‐cell lymphoma based on the expression of 2 genes reflecting tumor and microenvironment. Blood. 2011;118:1350‐1358. [DOI] [PMC free article] [PubMed] [Google Scholar]
- 34. Guo NL, Wan YW. Pathway‐based identification of a smoking associated 6‐gene signature predictive of lung cancer risk and survival. Artif Intell Med. 2012;55:97‐105. [DOI] [PMC free article] [PubMed] [Google Scholar]
- 35. Meng J, Li P, Zhang Q, Yang Z, Fu S. A four‐long non‐coding RNA signature in predicting breast cancer survival. J Exp Clin Cancer Res. 2014;33:84. [DOI] [PMC free article] [PubMed] [Google Scholar]
- 36. Tu Z, He D, Deng X, et al. An eight‐long non‐coding RNA signature as a candidate prognostic biomarker for lung cancer. Oncol Rep. 2016;36:215‐222. [DOI] [PubMed] [Google Scholar]
- 37. Tang W, Dong K, Li K, Dong R, Zheng S. MEG3, HCN3 and linc01105 influence the proliferation and apoptosis of neuroblastoma cells via the HIF‐1alpha and p53 pathways. Sci Rep. 2016;6:36268. [DOI] [PMC free article] [PubMed] [Google Scholar]
- 38. Liang J, Lv J, Liu Z. Identification of stage‐specific biomarkers in lung adenocarcinoma based on RNA‐seq data. Tumour Biol. 2015;36:6391‐6399. [DOI] [PubMed] [Google Scholar]
- 39. Maccani JZ, Koestler DC, Houseman EA, Armstrong DA, Marsit CJ, Kelsey KT. DNA methylation changes in the placenta are associated with fetal manganese exposure. Reprod Toxicol. 2015;57:43‐49. [DOI] [PMC free article] [PubMed] [Google Scholar]
- 40. Zhao L, Ji G, Le X, et al. Long noncoding RNA LINC00092 acts in cancer‐associated fibroblasts to drive glycolysis and progression of ovarian cancer. Can Res. 2017;77:1369‐1382. [DOI] [PubMed] [Google Scholar]
- 41. Goldstraw P, Crowley J, Chansky K, et al. The IASLC Lung Cancer Staging Project: proposals for the revision of the TNM stage groupings in the forthcoming (seventh) edition of the TNM Classification of malignant tumours. J Thorac Oncol. 2007;2:706‐714. [DOI] [PubMed] [Google Scholar]
- 42. Groome PA, Bolejack V, Crowley JJ, et al. The IASLC Lung Cancer Staging Project: validation of the proposals for revision of the T, N, and M descriptors and consequent stage groupings in the forthcoming (seventh) edition of the TNM classification of malignant tumours. J Thorac Oncol. 2007;2:694‐705. [DOI] [PubMed] [Google Scholar]
- 43. I H, Cho JY. Lung cancer biomarkers. Adv Clin Chem. 2015;72:107‐170. [DOI] [PubMed] [Google Scholar]
- 44. Sun S, Schiller JH, Gazdar AF. Lung cancer in never smokers–a different disease. Nat Rev Cancer. 2007;7:778‐790. [DOI] [PubMed] [Google Scholar]
- 45. Toh CK, Gao F, Lim WT, et al. Never‐smokers with lung cancer: epidemiologic evidence of a distinct disease entity. J Clin Oncol. 2006;24:2245‐2251. [DOI] [PubMed] [Google Scholar]


