

Abstract
Liquid biopsy offers a potential alternative to tissue biopsy for detection of genetic alterations in cancer, and it has been introduced into clinical practice to detect the tyrosine kinase inhibitor (TKI) resistance‐conferring T790M mutation of epidermal growth factor receptor (EGFR) in patients with non‐small‐cell lung cancer (NSCLC). We prospectively collected tumor and plasma samples from 25 NSCLC patients who harbored activating mutations of EGFR and experienced failure of treatment with afatinib. The samples were analyzed by digital PCR (dPCR) and next‐generation sequencing (NGS). T790M was detected in plasma with a respective sensitivity and specificity of 83.3% and 70.0% by dPCR and 50.0% and 70.0% by NGS relative to analysis of corresponding tumor samples. Quantitation of T790M based on the ratio of the number of T790M alleles to that of activating mutation alleles (T/A ratio) improved the specificity of plasma analysis to 100% for both dPCR and NGS without a reduction in sensitivity. Although several afatinib resistance mechanisms other than T790M—including copy number gain of NRAS or MET—were identified in tumor samples, the corresponding genetic alterations were not detected in plasma. TP53 mutations were frequently identified in plasma and tumor samples, with most such mutations also having been detected before afatinib treatment. The presence of de novo TP53 mutations was associated with reduced progression‐free survival. Quantitation of T790M in plasma is thus a clinically relevant approach to determine the T790M status of tumors. In addition, genetic alterations coexisting with EGFR mutations can affect the efficacy of EGFR‐TKI treatment.
Keywords: afatinib, circulating tumor DNA, digital PCR, next‐generation sequencing, resistance mechanism
1. INTRODUCTION
Epidermal growth factor receptor (EGFR) tyrosine kinase inhibitors (TKI) show marked efficacy for treatment of non‐small‐cell lung cancer (NSCLC) positive for activating mutations of EGFR.1, 2, 3, 4, 5, 6, 7 Isolation of circulating cell‐free DNA (cfDNA) from blood samples as a liquid biopsy can be carried out in cancer patients in a noninvasive and repetitive way, with analysis of the cfDNA having the potential to provide insight into the extent of intratumoral heterogeneity.8, 9 Such an approach has been introduced into clinical practice to detect activating mutations or the TKI resistance‐conferring T790M mutation of EGFR in patients with NSCLC.10, 11, 12, 13, 14, 15, 16 Monitoring of cfDNA by digital PCR (dPCR) has been shown to be informative for prediction of EGFR‐TKI efficacy, whereas that by next‐generation sequencing (NGS) has the potential to identify mechanisms of treatment resistance.16 Liquid biopsy thus offers a promising alternative to tissue biopsy both for the detection of genetic alterations that can inform the selection of corresponding targeted drugs and for exploration of mechanisms of resistance to such drugs.
Third‐generation EGFR‐TKI osimertinib prolonged progression‐free survival (PFS) compared with platinum chemotherapy plus pemetrexed in patients with NSCLC positive for activating mutations of EGFR who acquired the T790M mutation and whose disease progressed during previous EGFR‐TKI therapy.17 Detection of T790M at the time of progression is therefore essential for determination of the optimal subsequent treatment for this patient population. Given that tumor biopsy is invasive and not always feasible, liquid biopsy could be an important alternative for such analysis. Analysis by NGS has the potential to detect several genetic alterations such as TP53 mutations that exist together with EGFR mutations, but little is known of how such coexisting genetic alterations affect clinical outcome.18, 19
We previously showed that monitoring of cfDNA by dPCR is informative for prediction of the efficacy of the second‐generation EGFR‐TKI afatinib in NSCLC patients positive for EGFR activating mutations and that allele frequency for somatic mutations in cfDNA determined by NGS changed concordantly during afatinib treatment with the number of EGFR mutant alleles determined by dPCR.16 In the present study, both tumor and plasma samples were prospectively collected from these patients at the time of treatment failure and were examined for genetic alterations with both dPCR and NGS in order to investigate mechanisms of resistance to afatinib treatment.
2. MATERIALS AND METHODS
2.1. Study design and participants
Between 20 May and 25 November 2014, a total of 35 patients who had not previously been treated with EGFR‐TKI were enrolled in the present study from 10 institutions across Japan. The patients had histologically or cytologically confirmed adenocarcinoma of the lung at stage IIIB or IV or postoperative recurrence, and they were positive for a common activating mutation of EGFR (an exon 19 deletion [Ex19del] or the L858R point mutation). They received a single daily dose of afatinib at a starting dose of 40 mg until development of progressive disease (PD) or intolerable adverse events, or until withdrawal of consent. Detailed information regarding study design as well as the baseline demographics and clinical characteristics of the patients has been presented previously.16 All patients provided written informed consent, and the study was carried out in accordance with the Declaration of Helsinki and was approved by the Institutional Review Board of each institution.
2.2. Sample collection
Tumor and plasma samples were collected before afatinib treatment and after treatment failure with disease progression (systemic PD). Blood samples (14 mL) were collected in tubes containing EDTA (disodium salt) and were centrifuged at 1400 g for 10 minutes at room temperature within 1 hour of collection. The supernatant was stored at −80°C until analysis. Detailed protocols for isolation of DNA from tumor samples and from blood samples (cfDNA) are provided in Doc. S1.
2.3. Scorpion amplification‐refractory mutation system
We carried out allele‐specific PCR analysis by Scorpion ARMS (amplification‐refractory mutation system) with a Therascreen EGFR RGQ PCR Kit (QIAGEN K.K., Tokyo, Japan) as a conventional method to detect activating and T790M mutations of EGFR in tumor samples. Details are provided in Doc. S1.
2.4. Nanofluidic dPCR analysis
The principles and details of the nanofluidic dPCR system (BioMark HD System; Fluidigm, South San Francisco, CA, USA) as carried out with the Fluidigm digital chip have been described previously.16, 20 ARMS was carried out in each reaction chamber targeting either the control region (exon 2), activating mutations (Ex19del or L858R), or T790M of EGFR in both tumor and plasma samples. We carried out duplicate assays (two panels) for detection of each target allele. Tumor samples collected from 15 NSCLC patients without EGFR activating mutations were analyzed to determine the cutoff for T790M positivity in tumor samples (Table S1). The number of positive signals observed in the T790M reaction panels increased with the estimated number of control alleles applied (Figure S1). A tumor sample was thus considered positive for T790M if the ratio of the number of positive signals in the T790M reaction to the number of control alleles was ≥0.54 (mean + 3 SD; Table S1). The concentration of cfDNA in plasma samples collected either from five patients with NSCLC negative for EGFR activating mutations or from five healthy donors was much lower than that of tumor DNA, with the result that essentially no signal for T790M was detected with the plasma samples (Table S2). We therefore set a cutoff for T790M positivity in plasma samples different from that in tumor samples. On the basis of this analysis, plasma samples were thus considered positive for T790M if the ratio of the number of positive signals in the T790M reaction to the number of control alleles was ≥0.17 (mean + 3 SD).
2.5. Next‐generation sequencing analysis
Tumor and cfDNA samples were analyzed with NGS panels for mutation detection. For library preparation, tumor DNA (10 ng) and cfDNA (maximum of 3000 copies) were subjected to multiplex PCR amplification with the use of an Ion AmpliSeq Library Kit 2.0 (Life Technologies, Carlsbad, CA, USA) and Ion AmpliSeq Colon and Lung Cancer Panel v2 (Life Technologies), the latter of which targets 22 cancer‐associated genes, with 92 amplicons covering 1205 hotspot mutations. Details are provided in Doc. S1.
2.6. Statistical analysis
Details are provided in Doc. S1.
3. RESULTS
3.1. Patient population and clinical outcomes
We have previously indicated marked antitumor activity and tolerable toxicity of afatinib treatment in a prospective study.16 We updated the data at a median follow‐up time of 15.8 months (range, 0.9‐41.7 months) as a result of an increase in events related to PFS. Of the 35 patients enrolled in the study, 27 individuals (77.1%; 95% CI, 63.2%‐91.1%) showed a partial response and 31 (88.6%; 95% CI, 78.0%‐99.1%) achieved disease control. Thirty‐four (97.1%) patients discontinued treatment as a result of systemic PD (n = 28, 80.0%), adverse events (n = 5, 14.3%), or treatment refusal (n = 1, 2.9%), whereas one (2.9%) patient was still receiving treatment with afatinib. Median PFS was 14.3 months (95% CI, 10.3‐19.8 months; Figure S2A), with PFS for patients with an Ex19del mutation of EGFR being slightly longer than that for those with the L858R mutation (15.1 vs 10.8 months, P = 0.88; Figure S2B). Median time to systemic PD was 16.3 months (95% CI, 10.8‐20.4 months; Figure S2C), with the value for patients with an Ex19del mutation being slightly greater than that for those with the L858R mutation (17.9 vs 12.8 months, P = 0.87; Figure S2D). All 35 patients received afatinib at a starting dose of 40 mg/d. Twenty‐six (74.3%) patients required a dose reduction, with 13 (37.1%) requiring a dose reduction to 20 mg/d (data not shown). All adverse events leading to a dose reduction were due to nonhematological toxicity, with the most common such events including diarrhea, rash or acne, stomatitis, and nail effect (data not shown).
3.2. Evaluation of activating mutations and T790M of EGFR in tumor and plasma samples at development of systemic PD
For the 28 patients who experienced systemic PD, tumor or plasma samples were collected at the time of PD development from 25 individuals (17 with an Ex19del and 8 with L858R), with tumor, plasma, or both samples being available for 18, 23, and 16 individuals, respectively (Table 1). Among the 18 patients for whom tumor samples were available, EGFR activating mutations were identified in 16 (88.9%) and 17 (94.4%) individuals by dPCR and NGS, respectively (Table S3). In the case of the two patients for whom EGFR activating mutations were not detected in tumor samples by dPCR, such a mutation was also not detected by NGS in one patient (patient #12). Given that an EGFR activating mutation was detected in the tumor sample obtained from this patient before afatinib treatment, the mutation may have disappeared during treatment or the tumor sampling sites may have differed between before and after failure of afatinib treatment (intratumoral heterogeneity). An activating mutation was not detected by dPCR in patient #7 because the mutation type (Ex19del, p.S752_I759 del) is not recognizable by dPCR. The T790M mutation of EGFR was detected in nine (50.0%), 10 (55.6%), and eight (44.4%) of the 18 tumor samples obtained at the time of systemic PD development by dPCR, NGS, and ARMS, respectively (Table 1, Table S3).
Table 1.
Concordance of T790M positivity between tumor and plasma samples as evaluated by dPCR, NGS, and ARMS (n = 25)
| Patient | Activating mutation identified before afatinib treatment | Tumor samples (n = 18) | Plasma samples (n = 23) | |||
|---|---|---|---|---|---|---|
| dPCR | NGS | ARMS | dPCR | NGS | ||
| 1 | p.E746_A750 del | Yes | Yes | Yes | No | No |
| 2 | p.E746_A750 del | Yes | Yes | No | Yes | Yes |
| 3 | p.E746_A750 del | Yes | Yes | Yes | Yes | Yes |
| 4 | L858R | Yes | Yes | Yes | Yes | No |
| 5 | L858R | Yes | Yes | Yes | Yes | Yes |
| 6 | p.E746_A750 del | Yes | Yes | Yes | Yes | Yes |
| 7 | p.S752_I759 del | Yes | Yes | Yes | Yes | No |
| 8 | p.E746_A750 del | No | No | No | No | No |
| 9 | p.E746_A750 del | No | No | No | No | No |
| 10 | p.E746_A750 del | No | No | No | No | No |
| 11 | p.E746_A750 del | No | No | No | Yes | Yes |
| 12 | p.E746_S752>V | No | No | No | No | No |
| 13 | p.E746_A750 del | No | Yes | No | No | No |
| 14 | p.E746_A750 del | No | No | No | No | No |
| 15 | L858R | No | No | No | Yes | Yes |
| 16 | L858R | No | No | No | No | No |
| 17 | L858R | Yes | Yes | Yes | NA | NA |
| 18 | p.L747_P753>S | Yes | Yes | Yes | NA | NA |
| 19 | L858R | NA | NA | NA | No | No |
| 20 | p.E746_A750 del | NA | NA | NA | Yes | Yes |
| 21 | p.E746_A750 del | NA | NA | NA | Yes | No |
| 22 | p.E746_A750 del | NA | NA | NA | Yes | Yes |
| 23 | p.E746_A750 del | NA | NA | NA | Yes | Yes |
| 24 | L858R | NA | NA | NA | No | No |
| 25 | L858R | NA | NA | NA | Yes | Yes |
| T790M positivity | 9 Yes (50.0%) | 10 Yes (55.6%) | 8 Yes (44.4%) | 13 Yes (56.5%) | 10 Yes (43.5%) | |
Discordant results among dPCR, NGS, and ARMS for tumor and plasma analysis are shaded in gray.
ARMS, amplification‐refractory mutation system; dPCR, digital PCR; NA, not available; NGS, next‐generation sequencing.
Among the 23 plasma samples obtained at the time of systemic PD development, EGFR activating mutations were identified in 16 (69.6%) and 14 (60.9%) samples by dPCR and NGS, respectively (Table S3). The T790M mutation was detected in 13 (56.5%) and 10 (43.5%) of these 23 samples by dPCR and NGS, respectively (Table 1, Table S3). Discordant results among dPCR, NGS, and ARMS for detection of T790M in tumor or plasma samples were obtained for eight (32%) of 25 patients (Table 1). In the case of the 16 patients for whom tumor and plasma samples were both available, sensitivity and specificity for detection of T790M in plasma (relative to that in tumor samples with the conventional method of ARMS) were 83.3% and 70.0%, respectively, for dPCR and 50.0% and 70.0%, respectively, for NGS (Figure 1A).
Figure 1.
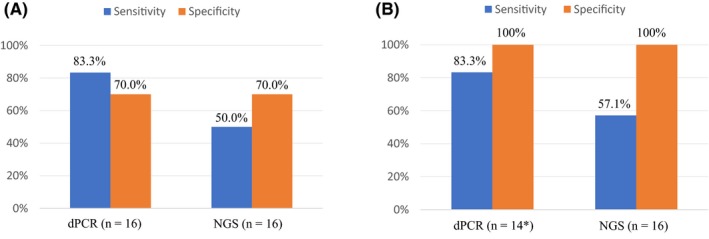
Sensitivity and specificity of digital PCR (dPCR) and next‐generation sequencing (NGS) for the detection of T790M in plasma samples compared with analysis of tumor samples. Positivity for T790M was determined without the use of the T/A ratio (A) or on the basis of the T/A ratio for plasma and tumor analysis (B). Asterisk indicates that two patients were excluded from the analysis either because the activating mutation (p.S752_I759 del) is not recognizable by dPCR (patient #7) or because the activating mutation seemed to disappear during afatinib treatment (patient #12). T/A ratio, number of T790M alleles to that of activating mutation alleles
3.3. Assessment of the T/A ratio for quantitative evaluation of T790M status in tumor and plasma samples at the time of systemic PD development
Given that a high ratio of the number of T790M alleles to that of activating mutation alleles (T/A ratio) in tumor or plasma samples has been associated with resistance to first‐generation EGFR‐TKI and with a high efficacy of third‐generation EGFR‐TKI,13, 21, 22 we calculated the T/A ratio for both dPCR and NGS and thereby quantitatively evaluated the T790M status of each sample (Tables 2, 3, S4, and S5). We determined that cutoffs for the T/A ratio of 5.0% in dPCR and of 10.0% in NGS allowed positivity for T790M evaluated by these techniques to fully match in both tumor (Figure S3) and plasma (Figure S4) samples. Application of these cutoffs for the T/A ratio improved the specificity of plasma analysis for the detection of T790M (compared with tumor analysis) to 100% for both dPCR and NGS, without a reduction in the sensitivity of either approach (Figure 1B). Such quantitative evaluation of T790M on the basis of the T/A ratio also reduced the number of discordant results among dPCR, NGS, and ARMS for the detection of T790M in tumor or plasma samples to three (12%) out of 25 patients (Table 4). For two (patients #1 and #4) of the three patients with discordant results, T790M was determined to be positive in tumor samples but not in plasma samples, possibly as a result of a low frequency of T790M alleles in the plasma samples. Given the consistent T790M positive results obtained for their tumor samples by dPCR, NGS, and ARMS, these two patients were considered to be T790M positive. For the remaining patient (patient #2) with discordant results, T790M was negative in the tumor sample by ARMS, with a ΔC t value of 7.49, which is close to the cutoff value of 7.40. We therefore considered this patient to be positive for T790M. On the basis of the various results, 13 (52.0%) of the 25 patients were deemed positive for T790M (Table 4).
Table 2.
Quantitative evaluation of T790M with the T/A ratio in tumor and plasma samples by dPCR (n = 25)
| Patient | Activating mutation identified before afatinib treatment | Tumor samples (n = 18) | Plasma samples (n = 23) | ||||
|---|---|---|---|---|---|---|---|
| Activating mutation/control (%) | T790M/control (%) | T/A (%) | Activating mutation/control (%) | T790M/control (%) | T/A (%) | ||
| 1 | p.E746_A750 del | 63.36 | 10.96 | 17.30 | 1.06 | 0 | 0 |
| 2 | p.E746_A750 del | 1.58 | 0.76 | 48.25 | 0.39 | 0.47 | 120.00 |
| 3 | p.E746_A750 del | 120.83 | 25.00 | 20.69 | 7.89 | 0.66 | 8.33 |
| 4 | L858R | 11.04 | 2.69 | 24.32 | 0.73 | 0.37 | 50.00 |
| 5 | L858R | 57.19 | 14.15 | 24.73 | 1.83 | 1.37 | 75.00 |
| 6 | p.E746_A750 del | 28.10 | 14.05 | 50.00 | 2.16 | 0.72 | 33.33 |
| 7 | p.S752_I759 del | 0 | 10.42 | NEa | 0 | 0.18 | NEa |
| 8 | p.E746_A750 del | 19.51 | 0 | 0 | 0 | 0 | 0 |
| 9 | p.E746_A750 del | 52.93 | 0 | 0 | 0 | 0 | 0 |
| 10 | p.E746_A750 del | 3.28 | 0.05 | 1.52 | 0 | 0 | 0 |
| 11 | p.E746_A750 del | 76.03 | 0 | 0 | 31.77 | 0.52 | 1.64 |
| 12 | p.E746_S752>V | 0 | 0.10 | NEb | 0 | 0 | 0 |
| 13 | p.E746_A750 del | 21.69 | 0.22 | 1.03 | 0.43 | 0 | 0 |
| 14 | p.E746_A750 del | 48.42 | 0.53 | 1.09 | 0.31 | 0 | 0 |
| 15 | L858R | 35.65 | 0.06 | 0.16 | 7.62 | 0.24 | 3.16 |
| 16 | L858R | 37.22 | 0 | 0 | 10.20 | 0 | 0 |
| 17 | L858R | 82.28 | 47.58 | 57.83 | NA | NA | NA |
| 18 | p.L747_P753>S | 44.44 | 6.67 | 15.00 | NA | NA | NA |
| 19 | L858R | NA | NA | NA | 0 | 0 | 0 |
| 20 | p.E746_A750 del | NA | NA | NA | 1.75 | 0.87 | 50.00 |
| 21 | p.E746_A750 del | NA | NA | NA | 1.38 | 2.07 | 150.00 |
| 22 | p.E746_A750 del | NA | NA | NA | 9.88 | 5.76 | 58.33 |
| 23 | p.E746_A750 del | NA | NA | NA | 137.72 | 0.34 | 0.25 |
| 24 | L858R | NA | NA | NA | 0 | 0 | 0 |
| 25 | L858R | NA | NA | NA | 5.48 | 1.71 | 31.25 |
| T790M positivity | 8 Yes (50.0%)c | 9 Yes (40.9%)d | |||||
T/A ratios of >5.0% are shown in bold. The T/A ratio was set to zero if both activating mutations and T790M were not detected.
The T/A ratio was not evaluable (NE) in this patient because the activating mutation (p.S752_I759 del) is not recognizable by dPCR.
The T/A ratio was not evaluable in this patient (shaded in gray) because the activating mutation seemed to disappear during afatinib treatment.
Patients #7 and #12 were excluded because of NE status.
Patient #7 was excluded because of NE status.
dPCR, digital PCR; NA, not available; T/A ratio, number of T790M alleles to that of activating mutation alleles.
Table 3.
Quantitative evaluation of T790M with the T/A ratio and additional somatic alterations detected in tumor and plasma samples by NGS (n = 25)
| Patient | Activating mutation identified before afatinib treatment | Tumor samples (n = 18) | Plasma samples (n = 23) | ||||||
|---|---|---|---|---|---|---|---|---|---|
| Allele frequency for activating mutation (%) | Allele frequency for T790M (%) | T/A (%) | Additional somatic alterations | Allele frequency for activating mutation (%) | Allele frequency for T790M (%) | T/A (%) | Additional somatic alterations | ||
| 1 | p.E746_A750 del | 52.56 | 39.56 | 75.27 | CTNNB1: p.S37Y | 0.16 | 0 | 0 | |
| 2 | p.E746_A750 del | 1.52 | 0.94 | 62.30 | 1.37 | 0.24 | 17.70 | ||
| 3 | p.E746_A750 del | 69.67 | 16.84 | 24.17 | 4.08 | 0.99 | 24.24 | ||
| 4 | L858R | 56.36 | 11.48 | 20.37 |
PIK3CA: p.E545K PIK3CA CNG TP53: p.Y236* |
0 | 0 | 0 | TP53: p.Y236* |
| 5 | L858R | 73.50 | 20.74 | 28.22 | 2.99 | 0.84 | 28.21 | ||
| 6 | p.E746_A750 del | 45.70 | 18.13 | 39.67 | 0.54 | 0.23 | 42.77 | ||
| 7 | p.S752_I759 del | 41.54 | 18.94 | 45.60 | 1.17 | 0 | 0 | ||
| 8 | p.E746_A750 del | 22.35 | 0 | 0 | TP53: p.M246L | 0 | 0 | 0 | |
| 9 | p.E746_A750 del | 63.83 | 0 | 0 | 0 | 0 | 0 | ||
| 10 | p.E746_A750 del | 10.80 | 0 | 0 | 0 | 0 | 0 | ||
| 11 | p.E746_A750 del | 71.97 | 0 | 0 | 27.71 | 0.39 | 1.39 | TP53: p.R248G | |
| 12 | p.E746_S752>V | 0 | 0 | 0 | TP53: p.R248W | 0 | 0 | 0 | TP53 p.R248W |
| 13 | p.E746_A750 del | 55.04 | 3.04 | 5.53 |
FGFR3: p.S378I NOTCH1: p.1581R NRAS CNG |
0 | 0 | 0 | |
| 14 | p.E746_A750 del | 44.71 | 0 | 0 | 0.14 | 0 | 0 | ||
| 15 | L858R | 41.33 | 0 | 0 |
MET
CNG
TP53: p.C277F |
5.21 | 0.42 | 8.12 | TP53: p.C277F |
| 16 | L858R | 65.80 | 0 | 0 | 5.73 | 0 | 0 | ||
| 17 | L858R | 79.40 | 54.48 | 68.61 |
EGFR CNG TP53: p.R273L |
NA | NA | NA | |
| 18 | p.L747_P753>S | 55.52 | 33.17 | 59.74 | TP53: p.V274F | NA | NA | NA | |
| 19 | L858R | NA | NA | NA | 0 | 0 | 0 | ||
| 20 | p.E746_A750 del | NA | NA | NA | 1.96 | 1.52 | 77.98 | ||
| 21 | p.E746_A750 del | NA | NA | NA | 3.23 | 0.39 | 12.15 | TP53: p.D281E | |
| 22 | p.E746_A750 del | NA | NA | NA | 6.96 | 4.93 | 70.86 | TP53: p.C242F | |
| 23 | p.E746_A750 del | NA | NA | NA | 50.15 | 0.32 | 0.65 | TP53 : p.S241Y | |
| 24 | L858R | NA | NA | NA | 0 | 0 | 0 | ||
| 25 | L858R | NA | NA | NA | 7.05 | 2.92 | 41.5 | ||
| T790M positivity | 9 Yes (50.0%) | 8 Yes (34.8%) | |||||||
T/A ratios >10.0% are shown in bold. The T/A ratio was set to zero if both activating mutations and T790M were not detected. The EGFR activating mutation detected in a tumor sample obtained before afatinib treatment seemed to disappear in patient #12 (shaded in gray). Somatic alterations that had been identified before afatinib treatment are shown in red.
CNG, copy number gain; EGFR, epidermal growth factor receptor; NA, not available; NGS, next‐generation sequencing; T/A ratio, number of T790M alleles to that of activating mutation alleles ; *, stop codon.
Table 4.
Summary of identified putative mechanisms of resistance to afatinib (n = 25)
| Patient | Activating mutation identified before afatinib treatment | Tumor samples (n = 18) | Plasma samples (n = 23) | Comprehensive assessment of T790M positivity | Putative resistance mechanisms other than T790M identified by NGS | |||
|---|---|---|---|---|---|---|---|---|
| T/A by dPCR (%) | T/A by NGS (%) | ARMS ΔC t value for T790M | T/A by dPCR (%) | T/A by NGS (%) | ||||
| 1 | p.E746_A750 del | 17.30 | 75.27 | 2.22 | 0 | 0 | Yes | |
| 2 | p.E746_A750 del | 48.25 | 62.30 | 7.49 | 120.00 | 17.70 | Yes | |
| 3 | p.E746_A750 del | 20.69 | 24.17 | 3.71 | 8.33 | 24.24 | Yes | |
| 4 | L858R | 24.32 | 20.37 | 5.17 | 50.00 | 0 | Yes | PIK3CA: p.E545K, PIK3CA CNG |
| 5 | L858R | 24.73 | 28.22 | 3.71 | 75.00 | 28.21 | Yes | |
| 6 | p.E746_A750 del | 50.00 | 39.67 | 3.67 | 33.33 | 42.77 | Yes | |
| 7 | p.S752_I759 del | NEa | 45.60 | 3.98 | NEa | 0 | Yes | |
| 8 | p.E746_A750 del | 0 | 0 | ND | 0 | 0 | ||
| 9 | p.E746_A750 del | 0 | 0 | 13.91 | 0 | 0 | ||
| 10 | p.E746_A750 del | 1.52 | 0 | 13.11 | 0 | 0 | ||
| 11 | p.E746_A750 del | 0 | 0 | 10.87 | 1.64 | 1.39 | ||
| 12 | p.E746_S752>V | NEb | 0 | ND | 0 | 0 | ||
| 13 | p.E746_A750 del | 1.03 | 5.53 | 13.08 | 0 | 0 | NRAS CNG | |
| 14 | p.E746_A750 del | 1.09 | 0 | ND | 0 | 0 | ||
| 15 | L858R | 0.16 | 0 | ND | 3.16 | 8.12 | MET CNG | |
| 16 | L858R | 0 | 0 | ND | 0 | 0 | ||
| 17 | L858R | 57.83 | 68.61 | 2.32 | NA | NA | Yes | EGFR CNG |
| 18 | p.L747_P753>S | 15.00 | 59.74 | 4.84 | NA | NA | Yes | |
| 19 | L858R | NA | NA | NA | 0 | 0 | ||
| 20 | p.E746_A750 del | NA | NA | NA | 50.00 | 77.98 | Yes | |
| 21 | p.E746_A750 del | NA | NA | NA | 150.00 | 12.15 | Yes | |
| 22 | p.E746_A750 del | NA | NA | NA | 58.33 | 70.86 | Yes | |
| 23 | p.E746_A750 del | NA | NA | NA | 0.25 | 0.65 | ||
| 24 | L858R | NA | NA | NA | 0 | 0 | ||
| 25 | L858R | NA | NA | NA | 31.25 | 41.5 | Yes | |
| T790M positivity | 8 Yes (50.0%) | 9 Yes (50.0%) | 8 Yes (44.4%) | 9 Yes (40.9%) | 8 Yes (34.8%) | 13 Yes (52.0%) | ||
T/A ratios >5.0% for dPCR and >10.0% for NGS as well as ΔC t values <7.40 for ARMS are shown in bold. Discordant results for T790M positivity among ARMS and the T/A ratio for dPCR and NGS are shaded in gray.
The T/A ratio was not evaluable (NE) because the activating mutation (p.S752_I759 del) is not recognizable by dPCR.
The T/A ratio was not evaluable because the activating mutation seemed to disappear during afatinib treatment.
ARMS, amplification‐refractory mutation system; CNG, copy number gain; dPCR, digital PCR; NA, not available; ND, not detected; NGS, next‐generation sequencing; T/A ratio, number of T790M alleles to that of activating mutation alleles.
3.4. Next‐generation sequencing analysis of somatic alterations other than T790M of EGFR
Among the 18 tumor samples obtained at the time of systemic PD development, the T790M mutation of EGFR alone (n = 7), copy number gain (CNG) of NRAS (n = 1), CNG of MET (n = 1), CNG of EGFR plus T790M (n = 1), and CNG and E545K of PIK3CA plus T790M of EGFR (n = 1) were identified by NGS as putative mechanisms of resistance to afatinib (Table 3). CNG of MET was also detected in the corresponding tumor sample obtained before treatment, with this patient experiencing systemic PD immediately after afatinib initiation. Putative resistance mechanisms other than T790M were not identified by NGS in plasma samples obtained at the time of systemic PD. Mechanisms of resistance to afatinib including the data for plasma analysis of T790M are summarized in Table 4 and Figure 2. Mutations of TP53 were identified in tumor or plasma samples obtained at systemic PD from 10 (40%) of the 25 patients with such samples available (Table 3).
Figure 2.
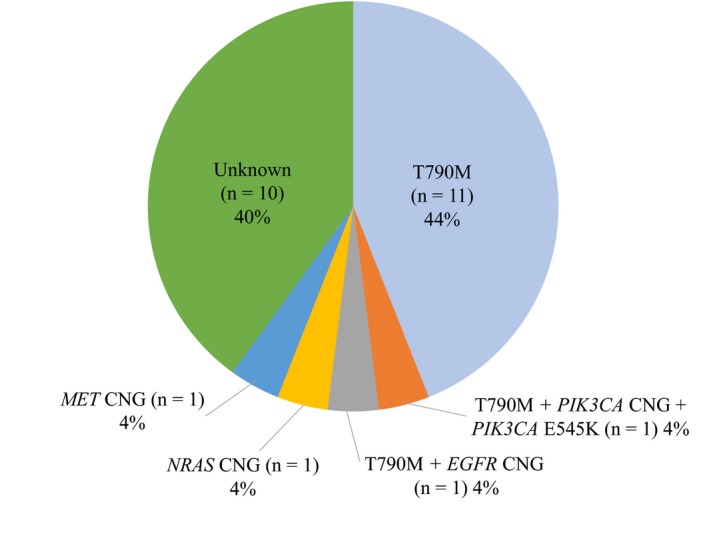
Frequency of putative mechanisms of acquired resistance to afatinib among the 25 patients for whom tumor or plasma samples were available at the time of systemic of progressive disease development. CNG, copy number gain; EGFR, epidermal growth factor receptor
3.5. Survival analysis according to TP53 mutation and EGFR T790M status
We previously identified a total of 45 mutations in tumor samples collected before afatinib treatment from 32 patients with such samples available,16 with TP53 mutations being found in 11 (34.4%) of these patients (Table S6). Median PFS was significantly shorter in patients whose tumors harbored a TP53 mutation before afatinib treatment than in those whose tumors did not (10.3 vs 15.1 months, P = 0.01; Figure 3A). Among the 18 patients with tumor samples obtained at the time of systemic PD development, median PFS was slightly longer in those with than in those without T790M as based on the T/A ratio at this time (15.1 vs 10.9 months, P = 0.25; Figure 3B). Although the difference also did not achieve statistical significance, median time to systemic PD was substantially longer in patients with T790M as based on the T/A ratio than in those without it (17.9 vs 10.9 months, P = 0.18; Figure 3C).
Figure 3.
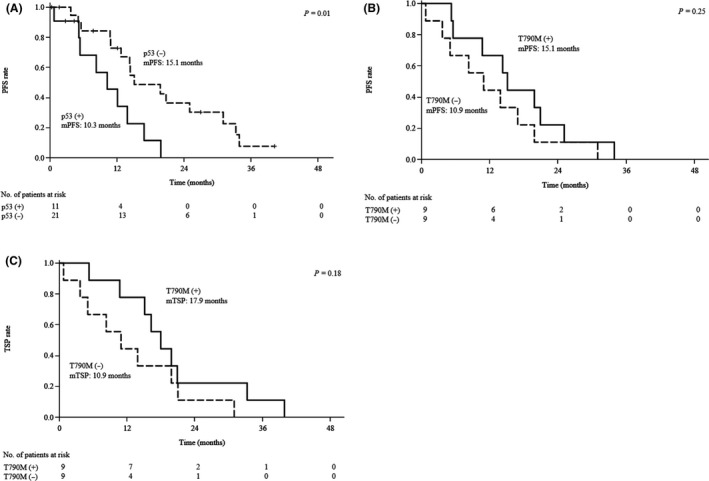
Survival analysis according to TP53 or EGFR T790M status. A, Kaplan‐Meier plots of progression‐free survival (PFS) for the study subjects according to TP53 mutation status in tumor samples obtained before afatinib treatment. B,C, Kaplan‐Meier plots of PFS and time to systemic progressive disease (PD) (TSP), respectively, for the study subjects according to T790M status based on the T/A ratio of tumor samples at systemic PD development. Median (m) values for PFS and TSP, and the P value for the difference between each pair of curves as determined with the log‐rank test, are indicated. EGFR, epidermal growth factor receptor; T/A ratio, number of T790M alleles to that of activating mutation alleles
4. DISCUSSION
In the present study, both tumor and plasma samples were prospectively collected from patients who experienced failure of afatinib treatment and were analyzed by dPCR and NGS. Without application of the T/A ratio, the T790M mutation of EGFR was positive in nine (50.0%), 10 (55.6%), and eight (44.4%) of 18 tumor samples obtained at the time of systemic PD development as evaluated by dPCR, NGS, and ARMS, respectively, and it was positive in 13 (56.5%) and 10 (43.5%) of 23 plasma samples by dPCR and NGS, respectively (Table 1). With evaluation of tumor samples by the allele‐specific PCR method (ARMS) as reference, the sensitivity and specificity of plasma analysis for T790M were 83.3% and 70.0%, respectively, for dPCR and 50.0% and 70.0%, respectively, for NGS (Figure 1A), values consistent with those reported in previous studies.13, 14 However, among the 16 plasma samples in which EGFR activating mutations were identified at the time of systemic PD development by dPCR, the detection rate for T790M by dPCR was 75.0% (12 of 16; Table S3). Among the 14 plasma samples in which EGFR activating mutations were detected at the time of systemic PD development by NGS, the detection rate for T790M by NGS was 71.4% (10 of 14; Table S3). These detection rates for T790M are much higher than those previously reported for tumor samples collected from patients who experienced resistance to first‐ or second‐generation EGFR‐TKI.23, 24, 25, 26 Although such a high frequency of T790M might be the result of selection bias due to the small number of samples, we considered the possibility that highly sensitive methods such as dPCR and NGS might detect a small population of T790M alleles in cfDNA that is not responsible for resistance to EGFR‐TKI and give rise to the low specificity of plasma analysis for the detection of T790M compared with tumor analysis. Such highly sensitive methods have been found to detect a small proportion of T790M alleles even in specimens obtained from NSCLC patients before treatment with EGFR‐TKI.20, 27, 28, 29 We previously showed that first‐generation EGFR‐TKI were effective for the treatment of tumors with a low T/A ratio determined by dPCR and that the T/A ratio increased markedly after the acquisition of EGFR‐TKI resistance.20 A high T/A ratio in tumor or plasma samples has also previously been associated with a high treatment efficacy of third‐generation EGFR‐TKI.13, 21, 22 These previous data suggest that assessment of the T/A ratio allows more accurate evaluation of the contribution of T790M to resistance to first‐ or second‐generation EGFR‐TKI and improves the concordance between liquid biopsy and tumor biopsy for the detection of T790M. We therefore applied the T/A ratio to determination of T790M positivity in tumor and plasma samples by dPCR and NGS, resulting in an improvement in the specificity of plasma analysis compared with tumor analysis to 100% without a reduction in sensitivity (Figure 1B).
Our comprehensive assessment based on the T/A ratio indicated that T790M was positive in 13 (52.0%) of 25 patients at the time of systemic PD development (Table 4, Figure 2). Median PFS for treatment with afatinib was longer in patients with than in those without T790M at systemic PD (15.1 vs 10.9 months, P = 0.25; Figure 3B), consistent with previous findings.26, 30 Although median time to systemic PD was longer than median PFS in patients with T790M at systemic PD (17.9 vs 15.1 months), such a difference was not apparent in patients without T790M at this time (10.9 vs 10.9 months; Figure 3C). The observation that T790M‐positive, TKI‐resistant cells grow more slowly than T790M‐negative cells in preclinical models31 may have influenced the judgment of the investigators as to whether to continue the treatment with afatinib after radiological progression.
Although several mechanisms of resistance to second‐generation EGFR‐TKI including afatinib and dacomitinib have been identified in preclinical models,32, 33, 34, 35 such mechanisms other than the T790M mutation have rarely been detected in clinical samples. With the use of NGS, we examined genetic alterations in tumor or plasma samples obtained from 25 patients at the time of systemic PD development during afatinib treatment. CNG of MET (n = 1, 4%), CNG of EGFR concurrent with T790M (n = 1, 4%), CNG and the E545K mutation of PIK3CA concurrent with T790M of EGFR (n = 1, 4%), and CNG of NRAS (n = 1, 4%) were identified as putative mechanisms of resistance to afatinib among the 18 tumor samples (Table 4, Figure 2). Amplification of MET and the E545K mutation of PIK3CA have been implicated in resistance to first‐generation EGFR‐TKI, together accounting for ~5% of patients who acquired resistance to these drugs.24, 25 Amplification of EGFR concurrent with T790M has been implicated in resistance to the second‐generation EGFR‐TKI dacomitinib in a preclinical study33 and was identified in plasma samples obtained from patients who acquired resistance to third‐generation EGFR‐TKI.36 Amplification of NRAS has been implicated in resistance to the third‐generation EGFR‐TKI naquotinib in a preclinical model.37 These previous data suggest that such genetic alterations constitute resistance mechanisms shared by various generations of EGFR‐TKI. Resistance‐related alterations coexisting with T790M of EGFR were identified in two patients of the present study, with such alterations having been implicated in reduced sensitivity to osimertinib.19 Evaluation of alterations coexisting with EGFR T790M is thus important for assessment of the efficacy of subsequent treatment with osimertinib in patients who acquire resistance to first‐ or second‐generation EGFR‐TKI. Amplification of HER2 and transformation to small‐cell carcinoma, which are also implicated in resistance to first‐generation EGFR‐TKI, were not identified in the present study. The irreversible and pan‐HER nature of inhibition by afatinib might give rise to a difference in resistance mechanisms compared with first‐generation EGFR‐TKI. The various resistance mechanisms identified in tumor samples of the present study were not detected by NGS in plasma samples obtained at systemic PD, possibly because we did not use an ultrasensitive method such as CAPP‐Seq for library preparation.19, 36, 38
Mutations of TP53 were frequently identified in plasma samples collected at the time of systemic PD development as well as in tumor samples (Table 3). In 9 (90.0%) of 10 patients for whom mutations of TP53 were detected in plasma or tumor samples at systemic PD, the same type of TP53 mutation was also detected in tumor or plasma samples obtained before initiation of afatinib treatment (Table 3). Median PFS was significantly shorter in patients whose tumors harbored a TP53 mutation before afatinib treatment than in those whose tumors did not (10.3 vs 15.1 months, P = 0.01; Figure 3A), consistent with previous findings.39 All these mutations were located in exons 5‐8 of TP53, which encode the DNA‐binding domain that recognizes a consensus sequence in the promoters of several genes related to DNA repair and apoptosis.40, 41 The p53 protein has been shown to enhance gefitinib‐induced apoptosis in NSCLC cells by upregulation of FAS, and TP53 mutations reduce sensitivity to EGFR‐TKI.42, 43 We previously showed that the allele frequency for TP53 mutations and that for EGFR‐activating mutations in plasma samples evaluated by NGS changed concordantly during afatinib treatment, with the frequencies declining during the period that afatinib was effective and increasing at disease progression.16 These findings suggest that the presence of de novo coexisting mutations of TP53 in plasma or tumor samples before EGFR‐TKI treatment may be a biomarker that predicts a limited efficacy of such drugs for EGFR mutation‐positive NSCLC. Coexisting minor mutations of EGFR that have been implicated in reduced efficacy of EGFR‐TKI44 were not detected in either tumor or plasma samples at baseline in the present study (data not shown).
There are several limitations to the present study. First, the sample size was small. Second, although the specificity of plasma analysis compared with tumor analysis was improved by the quantitative evaluation of T790M, the sensitivity of plasma analysis was still low. Given that false‐negative results are a major problem for liquid biopsy, clinicians need to be careful in interpreting the findings of cfDNA analysis. Finally, the efficacy of subsequent treatment with osimertinib according to the value of the T/A ratio was not evaluated because the enrolment period for this prospective study was long before the approval of osimertinib and the cobas EGFR Mutation Test v2 (Roche Diagnostics, Risch‐Rotkreuz, Switzerland), a companion diagnostic, in Japan. Further analysis based on the efficacy of osimertinib and application of this test is warranted to confirm the usefulness of the T/A ratio for determination of T790M positivity.
Next‐generation sequencing analysis of tumor or plasma samples is already in clinical use for determination of tumor molecular profiles in precision medicine. Such analysis can identify genetic alterations that coexist with EGFR‐activating mutations including a minor clone of the T790M mutation of EGFR and TP53 mutations. Quantitative evaluation of T790M will thus be important for assessment of the contribution of this mutation to EGFR‐TKI resistance. Further studies of the mechanisms of resistance to EGFR‐TKI and of the pathways that limit the tumor response to these drugs are warranted to overcome the problems associated with both intrinsic and acquired drug resistance.
CONFLICTS OF INTEREST
D. Harada has received honoraria from AstraZeneca, Bristol‐Myers Squibb, Eli Lilly Japan, Kyowa Hakko Kirin, Ono Pharmaceutical, and Yakult Honsha. K. Nosaki has received honoraria from AstraZeneca, Boehringer Ingelheim, Chugai Pharmaceutical, Eli Lilly Japan, Ono Pharmaceutical, Pfizer, and Taiho Pharmaceutical as well as research funding from MSD and Novartis. K. Hotta has received honoraria and research funding from AstraZeneca, Boehringer Ingelheim, Bristol‐Myers Squibb, Chugai Pharmaceutical, Eli Lilly Japan, MSD, Novartis, and Ono Pharmaceutical; honoraria from Nihon Kayaku and Taiho Pharmaceutical; and research funding from Astellas. M. Nishio has received honoraria and research funding from AstraZeneca, Boehringer Ingelheim, Bristol‐Myers Squibb, Chugai Pharmaceutical, Daiichi Sankyo Healthcare, Eli Lilly Japan, Merck Serono, MSD, Novartis, Ono Pharmaceutical, Pfizer, and Taiho Pharmaceutical as well as research funding from Astellas. T. Kurata has received honoraria from AstraZeneca, Boehringer Ingelheim, Bristol‐Myers Squibb, Chugai Pharmaceutical, Eli Lilly Japan, MSD, and Ono Pharmaceutical. H. Akamatsu has received honoraria from AstraZeneca, Boehringer Ingelheim, Chugai Pharmaceutical, Eli Lilly Japan, MSD, Novartis, Ono Pharmaceutical, Pfizer, and Taiho Pharmaceutical as well as research funding from MSD. K. Goto and K. Nishio have received honoraria and research funding from Boehringer Ingelheim. Y. Nakanishi has received honoraria from Boehringer Ingelheim. I. Okamoto has received honoraria from Boehringer Ingelheim as well as research funding from AstraZeneca, Boehringer Ingelheim, Bristol‐Myers Squibb, Chugai Pharmaceutical, Eli Lilly Japan, MSD, Ono Pharmaceutical, Pfizer, and Taiho Pharmaceutical. All other authors declare no potential conflicts of interest.
Supporting information
Iwama E, Sakai K, Azuma K, et al. Exploration of resistance mechanisms for epidermal growth factor receptor‐tyrosine kinase inhibitors based on plasma analysis by digital polymerase chain reaction and next‐generation sequencing. Cancer Sci. 2018;109:3921–3933. 10.1111/cas.13820
Funding information
This work was supported by Boehringer‐Ingelheim (no grant number).
Clinical trial number: UMIN000013806
REFERENCES
- 1. Mok TS, Wu YL, Thongprasert S, et al. Gefitinib or carboplatin‐paclitaxel in pulmonary adenocarcinoma. N Engl J Med. 2009;361:947‐957. [DOI] [PubMed] [Google Scholar]
- 2. Maemondo M, Inoue A, Kobayashi K, et al. Gefitinib or chemotherapy for non‐small‐cell lung cancer with mutated EGFR. N Engl J Med. 2010;362:2380‐2388. [DOI] [PubMed] [Google Scholar]
- 3. Mitsudomi T, Morita S, Yatabe Y, et al. Gefitinib versus cisplatin plus docetaxel in patients with non‐small‐cell lung cancer harbouring mutations of the epidermal growth factor receptor (WJTOG3405): an open label, randomised phase 3 trial. Lancet Oncol. 2010;11:121‐128. [DOI] [PubMed] [Google Scholar]
- 4. Rosell R, Carcereny E, Gervais R, et al. Erlotinib versus standard chemotherapy as first‐line treatment for European patients with advanced EGFR mutation‐positive non‐small‐cell lung cancer (EURTAC): a multicentre, open‐label, randomised phase 3 trial. Lancet Oncol. 2012;13:239‐246. [DOI] [PubMed] [Google Scholar]
- 5. Zhou C, Wu YL, Chen G, et al. Erlotinib versus chemotherapy as first‐line treatment for patients with advanced EGFR mutation‐positive non‐small‐cell lung cancer (OPTIMAL, CTONG‐0802): a multicentre, open‐label, randomised, phase 3 study. Lancet Oncol. 2011;12:735‐742. [DOI] [PubMed] [Google Scholar]
- 6. Sequist LV, Yang JC, Yamamoto N, et al. Phase III study of afatinib or cisplatin plus pemetrexed in patients with metastatic lung adenocarcinoma with EGFR mutations. J Clin Oncol. 2013;31:3327‐3334. [DOI] [PubMed] [Google Scholar]
- 7. Wu YL, Zhou C, Hu CP, et al. Afatinib versus cisplatin plus gemcitabine for first‐line treatment of Asian patients with advanced non‐small‐cell lung cancer harbouring EGFR mutations (LUX‐Lung 6): an open‐label, randomised phase 3 trial. Lancet Oncol. 2014;15:213‐222. [DOI] [PubMed] [Google Scholar]
- 8. Diaz LA Jr, Bardelli A. Liquid biopsies: genotyping circulating tumor DNA. J Clin Oncol. 2014;32:579‐586. [DOI] [PMC free article] [PubMed] [Google Scholar]
- 9. Dawson SJ, Tsui DW, Murtaza M, et al. Analysis of circulating tumor DNA to monitor metastatic breast cancer. N Engl J Med. 2013;368:1199‐1209. [DOI] [PubMed] [Google Scholar]
- 10. Oxnard GR, Paweletz CP, Kuang Y, et al. Noninvasive detection of response and resistance in EGFR‐mutant lung cancer using quantitative next‐generation genotyping of cell‐free plasma DNA. Clin Cancer Res. 2014;20:1698‐1705. [DOI] [PMC free article] [PubMed] [Google Scholar]
- 11. Thress KS, Brant R, Carr TH, et al. EGFR mutation detection in ctDNA from NSCLC patient plasma: a cross‐platform comparison of leading technologies to support the clinical development of AZD9291. Lung Cancer. 2015;90:509‐515. [DOI] [PubMed] [Google Scholar]
- 12. Frenel JS, Carreira S, Goodall J, et al. Serial next‐generation sequencing of circulating cell‐free DNA evaluating tumor clone response to molecularly targeted drug administration. Clin Cancer Res. 2015;21:4586‐4596. [DOI] [PMC free article] [PubMed] [Google Scholar]
- 13. Oxnard GR, Thress KS, Alden RS, et al. Association between plasma genotyping and outcomes of treatment with osimertinib (AZD9291) in advanced non‐small‐cell lung cancer. J Clin Oncol. 2016;34:3375‐3382. [DOI] [PMC free article] [PubMed] [Google Scholar]
- 14. Sacher AG, Paweletz C, Dahlberg SE, et al. Prospective validation of rapid plasma genotyping for the detection of EGFR and KRAS mutations in advanced lung cancer. JAMA Oncol. 2016;2:1014‐1022. [DOI] [PMC free article] [PubMed] [Google Scholar]
- 15. Takahama T, Sakai K, Takeda M, et al. Detection of the T790M mutation of EGFR in plasma of advanced non‐small cell lung cancer patients with acquired resistance to tyrosine kinase inhibitors (West Japan oncology group 8014LTR study). Oncotarget. 2016;7:58492‐58499. [DOI] [PMC free article] [PubMed] [Google Scholar]
- 16. Iwama E, Sakai K, Azuma K, et al. Monitoring of somatic mutations in circulating cell‐free DNA by digital PCR and next‐generation sequencing during afatinib treatment in patients with lung adenocarcinoma positive for EGFR activating mutations. Ann Oncol. 2017;28:136‐141. [DOI] [PubMed] [Google Scholar]
- 17. Mok TS, Wu YL, Ahn MJ, et al. Osimertinib or platinum‐pemetrexed in EGFR T790M‐positive lung cancer. N Engl J Med. 2017;376:629‐640. [DOI] [PMC free article] [PubMed] [Google Scholar]
- 18. Clinical Lung Cancer Genome Project (CLCGP) and Network Genomic Medicine (NGM) . A genomics‐based classification of human lung tumors. Sci Transl Med. 2013;5:209ra153. [DOI] [PMC free article] [PubMed] [Google Scholar]
- 19. Blakely CM, Watkins TBK, Wu W, et al. Evolution and clinical impact of co‐occurring genetic alterations in advanced‐stage EGFR‐mutant lung cancers. Nat Genet. 2017;49:1693‐1704. [DOI] [PMC free article] [PubMed] [Google Scholar]
- 20. Iwama E, Takayama K, Harada T, et al. Highly sensitive and quantitative evaluation of the EGFR T790M mutation by nanofluidic digital PCR. Oncotarget. 2015;6:20466‐20473. [DOI] [PMC free article] [PubMed] [Google Scholar]
- 21. Piotrowska Z, Niederst MJ, Karlovich CA, et al. Heterogeneity underlies the emergence of EGFRT790 wild‐type clones following treatment of T790M‐positive cancers with a third‐generation EGFR inhibitor. Cancer Discov. 2015;5:713‐722. [DOI] [PMC free article] [PubMed] [Google Scholar]
- 22. Karlovich C, Goldman JW, Sun JM, et al. Assessment of EGFR mutation status in matched plasma and tumor tissue of NSCLC patients from a phase I study of rociletinib (CO‐1686). Clin Cancer Res. 2016;22:2386‐2395. [DOI] [PMC free article] [PubMed] [Google Scholar]
- 23. Kobayashi S, Boggon TJ, Dayaram T, et al. EGFR mutation and resistance of non‐small‐cell lung cancer to gefitinib. N Engl J Med. 2005;352:786‐792. [DOI] [PubMed] [Google Scholar]
- 24. Sequist LV, Waltman BA, Dias‐Santagata D, et al. Genotypic and histological evolution of lung cancers acquiring resistance to EGFR inhibitors. Sci Transl Med. 2011;3:75ra26. [DOI] [PMC free article] [PubMed] [Google Scholar]
- 25. Yu HA, Arcila ME, Rekhtman N, et al. Analysis of tumor specimens at the time of acquired resistance to EGFR‐TKI therapy in 155 patients with EGFR‐mutant lung cancers. Clin Cancer Res. 2013;19:2240‐2247. [DOI] [PMC free article] [PubMed] [Google Scholar]
- 26. Tanaka K, Nosaki K, Otsubo K, et al. Acquisition of the T790M resistance mutation during afatinib treatment in EGFR tyrosine kinase inhibitor‐naive patients with non‐small cell lung cancer harboring EGFR mutations. Oncotarget. 2017;8:68123‐68130. [DOI] [PMC free article] [PubMed] [Google Scholar]
- 27. Rosell R, Molina MA, Costa C, et al. Pretreatment EGFR T790M mutation and BRCA1 mRNA expression in erlotinib‐treated advanced non‐small‐cell lung cancer patients with EGFR mutations. Clin Cancer Res. 2011;17:1160‐1168. [DOI] [PubMed] [Google Scholar]
- 28. Su KY, Chen HY, Li KC, et al. Pretreatment epidermal growth factor receptor (EGFR) T790M mutation predicts shorter EGFR tyrosine kinase inhibitor response duration in patients with non‐small‐cell lung cancer. J Clin Oncol. 2012;30:433‐440. [DOI] [PubMed] [Google Scholar]
- 29. Costa C, Molina MA, Drozdowskyj A, et al. The impact of EGFR T790M mutations and BIM mRNA expression on outcome in patients with EGFR‐mutant NSCLC treated with erlotinib or chemotherapy in the randomized phase III EURTAC trial. Clin Cancer Res. 2014;20:2001‐2010. [DOI] [PubMed] [Google Scholar]
- 30. Lee CK, Kim S, Lee JS, et al. Next‐generation sequencing reveals novel resistance mechanisms and molecular heterogeneity in EGFR‐mutant non‐small cell lung cancer with acquired resistance to EGFR‐TKIs. Lung Cancer. 2017;113:106‐114. [DOI] [PubMed] [Google Scholar]
- 31. Chmielecki J, Foo J, Oxnard GR, et al. Optimization of dosing for EGFR‐mutant non‐small cell lung cancer with evolutionary cancer modeling. Sci Transl Med. 2011;3:90ra59. [DOI] [PMC free article] [PubMed] [Google Scholar]
- 32. Azuma K, Kawahara A, Sonoda K, et al. FGFR1 activation is an escape mechanism in human lung cancer cells resistant to afatinib, a pan‐EGFR family kinase inhibitor. Oncotarget. 2014;5:5908‐5919. [DOI] [PMC free article] [PubMed] [Google Scholar]
- 33. Ercan D, Zejnullahu K, Yonesaka K, et al. Amplification of EGFR T790M causes resistance to an irreversible EGFR inhibitor. Oncogene. 2010;29:2346‐2356. [DOI] [PMC free article] [PubMed] [Google Scholar]
- 34. Yamaoka T, Ohmori T, Ohba M, et al. Distinct afatinib resistance mechanisms identified in lung adenocarcinoma harboring an EGFR mutation. Mol Cancer Res. 2017;15:915‐928. [DOI] [PubMed] [Google Scholar]
- 35. Murakami Y, Sonoda K, Abe H, et al. The activation of SRC family kinases and focal adhesion kinase with the loss of the amplified, mutated EGFR gene contributes to the resistance to afatinib, erlotinib and osimertinib in human lung cancer cells. Oncotarget. 2017;8:70736‐70751. [DOI] [PMC free article] [PubMed] [Google Scholar]
- 36. Chabon JJ, Simmons AD, Lovejoy AF, et al. Circulating tumour DNA profiling reveals heterogeneity of EGFR inhibitor resistance mechanisms in lung cancer patients. Nat Commun. 2016;7:11815. [DOI] [PMC free article] [PubMed] [Google Scholar]
- 37. Ninomiya K, Ohashi K, Makimoto G, et al. MET or NRAS amplification is an acquired resistance mechanism to the third‐generation EGFR inhibitor naquotinib. Sci Rep. 2018;8:1955. [DOI] [PMC free article] [PubMed] [Google Scholar]
- 38. Newman AM, Bratman SV, To J, et al. An ultrasensitive method for quantitating circulating tumor DNA with broad patient coverage. Nat Med. 2014;20:548‐554. [DOI] [PMC free article] [PubMed] [Google Scholar]
- 39. Canale M, Petracci E, Delmonte A, et al. Impact of TP53 mutations on outcome in EGFR‐mutated patients treated with first‐line tyrosine kinase inhibitors. Clin Cancer Res. 2017;23:2195‐2202. [DOI] [PubMed] [Google Scholar]
- 40. Levine AJ. p53, the cellular gatekeeper for growth and division. Cell. 1997;88:323‐331. [DOI] [PubMed] [Google Scholar]
- 41. Riley T, Sontag E, Chen P, Levine A. Transcriptional control of human p53‐regulated genes. Nat Rev Mol Cell Biol. 2008;9:402‐412. [DOI] [PubMed] [Google Scholar]
- 42. Munsch D, Watanabe‐Fukunaga R, Bourdon JC, et al. Human and mouse Fas (APO‐1/CD95) death receptor genes each contain a p53‐responsive element that is activated by p53 mutants unable to induce apoptosis. J Biol Chem. 2000;275:3867‐3872. [DOI] [PubMed] [Google Scholar]
- 43. Rho JK, Choi YJ, Ryoo BY, et al. p53 enhances gefitinib‐induced growth inhibition and apoptosis by regulation of Fas in non‐small cell lung cancer. Cancer Res. 2007;67:1163‐1169. [DOI] [PubMed] [Google Scholar]
- 44. Kim EY, Cho EN, Park HS, et al. Compound EGFR mutation is frequently detected with co‐mutations of actionable genes and associated with poor clinical outcome in lung adenocarcinoma. Cancer Biol Ther. 2016;17:237‐245. [DOI] [PMC free article] [PubMed] [Google Scholar]
Associated Data
This section collects any data citations, data availability statements, or supplementary materials included in this article.
Supplementary Materials