

Abstract
Angiogenesis inhibitors such as lenvatinib and sorafenib, and an immune checkpoint inhibitor (ICI), nivolumab, are used for anticancer therapies against advanced hepatocellular carcinoma (HCC). Combination treatments comprising angiogenesis inhibitors plus ICIs are promising options for improving clinical benefits in HCC patients, and clinical trials are ongoing. Here, we investigated the antitumor and immunomodulatory activities of lenvatinib (a multiple receptor tyrosine kinase inhibitor targeting vascular endothelial growth factor receptor 1‐3, fibroblast growth factor receptor 1‐4, platelet‐derived growth factor receptor α, KIT and RET) and the combined antitumor activity of lenvatinib plus anti‐programmed cell death 1 (PD‐1) antibody in the Hepa1‐6 mouse HCC syngeneic model. We found that the antitumor activities of lenvatinib and sorafenib were not different in immunodeficient mice, but lenvatinib showed more potent antitumor activity than sorafenib in immunocompetent mice. The antitumor activity of lenvatinib was greater in immunocompetent mice than in immunodeficient mice and was attenuated by CD8+ T cell depletion. Treatment with lenvatinib plus anti‐PD‐1 antibody resulted in more tumor regression and a higher response rate compared with either treatment alone in immunocompetent mice. Single‐cell RNA sequencing analysis demonstrated that treatment with lenvatinib with or without anti‐PD‐1 antibody decreased the proportion of monocytes and macrophages population and increased that of CD8+ T cell populations. These data suggest that lenvatinib has immunomodulatory activity that contributes to the antitumor activity of lenvatinib and enhances the antitumor activity in combination treatment with anti‐PD‐1 antibody. Combination treatment of lenvatinib plus anti‐PD‐1 antibody therefore warrants further investigation against advanced HCC.
Keywords: anti‐PD‐1 antibody, hepatocellular carcinoma, immunomodulatory activity, lenvatinib, sorafenib
1. INTRODUCTION
Liver cancer is the second most common cause of death from cancer worldwide,1 with hepatocellular carcinoma (HCC) accounting for approximately 80% of primary malignant liver cancers.2 Although the incidence and mortality of HCC are relatively high in Asia and Africa (eg, approximately 50% of the total number of cases and deaths in China), the incidence and mortality of HCC have been increasing in the USA over the past few decades.3, 4 The multitargeted tyrosine kinase inhibitor sorafenib tosylate (sorafenib), which primarily targets Raf serine/threonine kinases, vascular endothelial growth factor receptor (VEGFR) 1‐3, platelet‐derived growth factor receptor (PDGFR) α and β, FLT3, RET and KIT, was approved for the treatment of unresectable HCC in 2007.5 Since then, sorafenib has been used as the only evidence‐based systemic treatment option for first‐line therapy in patients with advanced HCC. However, its overall outcomes are not fully satisfactory (objective response rate [ORR], 2%5) and there is an unmet medical need to improve anticancer therapy against advanced HCC.
Lenvatinib mesilate (lenvatinib) is an oral multitargeted tyrosine kinase inhibitor with antitumor and antiangiogenic activities via inhibition of VEGFR 1‐3, fibroblast growth factor receptor (FGFR) 1‐4, PDGFR α, RET and KIT.6 Preclinical studies have demonstrated that lenvatinib has potent antiangiogenic activity through inhibition of both the VEGF and FGF signaling pathways7 and shows antitumor activity consistently across diverse solid tumor models such as thyroid cancer, renal cell carcinoma (RCC) and HCC.6, 8, 9 Lenvatinib is used globally to treat progressive, locally recurrent or metastatic, radioactive iodine‐refractory differentiated thyroid cancer, and is used in Japan to treat unresectable thyroid cancer.10 In addition, the combination treatment of lenvatinib plus everolimus has been approved for metastatic RCC following a previous VEGF‐targeted therapy in the USA and the European Union (EU).11 Recently, lenvatinib showed non‐inferiority in overall survival and superiority in progression‐free survival, time to progression and ORR when compared with sorafenib as first‐line treatment for unresectable HCC in an international multicenter clinical trial.12 On the basis of the results of this trial, lenvatinib was recently approved for first‐line treatment of patients with unresectable HCC in the USA, the EU, China, Japan and other countries.
Recently, agents targeting immune checkpoint signaling have shown promising results in patients with several malignancies, such as melanoma and non‐small cell lung cancer.13, 14 Such agents may also be an attractive therapeutic option for HCC because an inflammatory tumor microenvironment is associated with improved survival.15, 16 In a phase 1 clinical trial, a cytotoxic T‐lymphocyte protein 4 (CTLA‐4) immune checkpoint inhibitor tremelimumab showed promising results (partial response rate, 17.6%; disease control rate, 76.4%) in patients with HCC.17 In addition, a programmed cell death 1 (PD‐1) immune checkpoint inhibitor nivolumab recently showed durable ORR (dose‐escalation phase, 15%; dose‐expansion phase, 20%) as a new systemic second‐line treatment in patients with HCC,18 and a global phase 3 trial is ongoing. Although these immune checkpoint inhibitors are potentially effective treatments for patients with HCC, combination treatments of different immune checkpoint inhibitors or immune checkpoint inhibitors plus targeted or locoregional therapies are expected to increase the benefits obtained from immune checkpoint blockade.19 A phase 1/2 clinical trial of nivolumab in combination with ipilimumab (NCT01658878) and phase 1b/2 clinical trials of lenvatinib in combination with anti‐PD‐1 antibody (Ab) (NCT03006926 and NCT03418922) are in progress for the treatment of patients with HCC.
To investigate the antitumor and immunomodulatory activities of lenvatinib alone and in combination with anti‐PD‐1 Ab against HCC tumors, we utilized the Hepa1‐6 mouse HCC syngeneic tumor model. We first compared the antitumor activities of lenvatinib with those of sorafenib by using immunocompetent and immunodeficient mice in the Hepa1‐6 model. Then we assessed whether lenvatinib treatment enhances the antitumor activity of anti‐PD‐1 Ab in the immunocompetent condition. Finally, we investigated the effects of lenvatinib alone and in combination with anti‐PD‐1 Ab on the immune cell populations in tumors by using single‐cell RNA sequencing (scRNA‐seq) analysis.
2. MATERIALS AND METHODS
2.1. Cells and reagents
Hepa1‐6 cells, derived from the BW7756 tumor in a C57L mouse, were obtained from the ATCC (Manassas, VA, USA). The cells were cultured in high‐glucose DMEM (Wako Pure Chemical Industries, Osaka, Japan) supplemented with 10% FBS (Sigma‐Aldrich, St. Louis, MO, USA) and 1% penicillin–streptomycin (Wako Pure Chemical Industries) at 37°C under a 5% CO2 atmosphere.
Lenvatinib was synthesized at Eisai (Ibaraki, Japan). Sorafenib was purchased from Bayer Yakuhin (Osaka, Japan). Anti‐mouse PD‐1 Ab (anti‐PD‐1 Ab; clone RMP1‐14), anti‐mouse CD8α Ab (anti‐CD8 Ab; clone YTS 169.4), and mouse isotype control IgG (control IgG; clone LTF‐2) were purchased from Bio X Cell (West Lebanon, NH, USA).
2.2. In vitro proliferation assay
Hepa1‐6 cells were plated on 96‐well plates at 1‐2 × 10³ cells/well and cultured at 37°C under a 5% CO2 atmosphere. The next day, the cells were treated with lenvatinib or sorafenib (.01‐30 μmol/L) and cultured for 3 days. Cell viability was determined by using a Cell Counting Kit‐8 (Dojindo, Kumamoto, Japan) and a SpectraMax 190 Microplate reader (Molecular Devices, Sunnyvale, CA, USA) with the bundled SoftMax Pro software (version 4.8, Molecular Devices) at a wavelength of 450 nm. IC50 values were determined by using GraphPad Prism 7 software (version 7.02; GraphPad Software, La Jolla, CA, USA).
2.3. In vivo Hepa1‐6 tumor models
Hepa1‐6 cells (4 × 10⁶ cells) were subcutaneously implanted in the right flank of 8‐10‐week‐old C57L/J mice purchased from The Jackson Laboratory (Bar Harbor, ME, USA), or CAnN.Cg‐Foxn1nu/CrlCrlj mice purchased from Charles River Laboratories Japan (Kanagawa, Japan). When the tumors reached a volume of around 100 mm3, mice were randomized into each treatment group and then lenvatinib (dissolved in 3 mmol/L HCl, 10 mg/kg) and sorafenib (dissolved in Cremophor EL:ethanol [1:1] and then diluted 4‐fold with distilled water, 30 mg/kg) were administered daily by oral gavage. Anti‐PD‐1 Ab (200 μg/head) was intraperitoneally administered twice weekly. Non‐treatment was set as the control group after confirmation that the vehicle solutions for each compound and the isotype control IgG did not have any antitumor activities and were comparable with non‐treatment (data not shown). The day on which treatment commenced was designated as day 1. The tumor volume (TV) was calculated as follows: TV (mm3) = .5 × (length [mm] × width2 [mm2]). The relative tumor volume (RTV) was calculated as follows: RTV = TVt/TV1, where TVt is the volume on day t after the start of treatment, and TV1 represents the volume on day 1. The values of ΔT/C (% of control for Δgrowth) were calculated with the following formula: (ΔT/ΔC) × 100, where ΔT and ΔC are changes in TV (Δgrowth) for drug treated and non‐treated control groups, respectively. In the case of reduction of TV, ΔT/C values were calculated according to the following formula: ΔT/C (%) = (TVt − TV1)/TV1 × 100. The relative body weight was calculated as the ratio of the mean body weight at a given time point to the mean body weight at the initiation of dosing. For flow cytometry (FCM) analysis and single‐cell analysis, tumor tissues were collected at day 8. All animal experiments were performed in accordance with the guidelines approved by the Institutional Animal Care and Use Committee of Eisai. All animal experiment data shown are representative of at least 2 independent experiments.
2.4. CD8+ T cell depletion by anti‐mouse CD8α antibody
Nine days after inoculation of Hepa1‐6 cells into C57L/J mice, mice were intraperitoneally injected with either control IgG (200 μg/head) or anti‐CD8 Ab (200 μg/head). Three days after control IgG or anti‐CD8 Ab injection (day 1), both groups were divided into 3 groups: non‐treatment, lenvatinib treatment, and sorafenib treatment. Lenvatinib or sorafenib were orally administered once daily. Control IgG or anti‐CD8 Ab was also intraperitoneally injected twice weekly.
2.5. Response evaluation
Tumor volume change at time t (ΔTV) was expressed as a percentage of the baseline value as follows: ΔTV = 100% × ([TVt − TV1]/TV1). The best response was the minimum value of ΔTV for t ≥ 11 days. For each time t, the average ΔTV from t = 1 to t was also calculated. Response was evaluated based on modified RECIST (Response Evaluation Criteria in Solid Tumors) criteria for mouse studies20, 21 and defined as follows (applied in this order): complete response (CR), best response <−95%; partial response (PR), best response <−50%; stable disease (SD), best response <35%; progressive disease (PD), not otherwise categorized.
2.6. Flow cytometry analysis and immune cell profiling by viSNE analysis
Tumor tissues resected from mice were dissociated into single cells by using a Tumor Dissociation Kit and a gentleMACS Dissociator (Miltenyi Biotec, Bergisch Gladbach, Germany). In cell mixtures, leukocytes positive for CD45 were isolated with mouse CD45 (TIL) microbeads (Miltenyi Biotec) by using an OctoMACS Separator (Miltenyi Biotec). After washing and filtration, cells were blocked with a Mouse BD Fc Block (BD Biosciences, San Jose, CA, USA), and stained with an Ab panel (Table S1) and DAPI (4′,6‐diamidino‐2‐phenylindole; Dojindo). Cells were analyzed with a LSRFortessa X‐20 flow cytometer (BD Biosciences), and then viSNE analysis22 was conducted with Cytobank software (Cytobank, Santa Clara, CA, USA).
2.7. Single‐cell analysis
After tumor dissociation and isolation of CD45+ cells as described for FCM analysis, isolated cells were pooled in equal numbers (n = 3 in each group). The scRNA‐seq libraries of extracted CD45+ cells were prepared using the Chromium Controller, and Chromium Single Cell 3′ Library and Gel Bead Kit v2 (10x Genomics, Pleasanton, CA, USA). Sequencing of the libraries was performed on a NextSeq 500 system with a High Output Kit (150 cycles; Illumina, San Diego, CA, USA). The Cell Ranger Suite (version 2.1.0; 10x Genomics) was used to perform sample de‐multiplexing, barcode processing and single‐cell gene unique molecular identifier (UMI) counting. The gene‐cell‐barcode matrices from 4 samples were merged into 1 matrix (27 998 genes × 7607 cells) and then loaded into the R package Seurat (version 2.2)23 for data quality control and downstream analysis. We then excluded 12 094 genes detected in <3 cells. To filter out low‐quality cells, 151 cells with a mitochondrial read rate of >10%, or number of detected genes of <500 or >5000 were excluded. Eventually, 15 904 genes and 7456 cells were selected and used for downstream analysis. The UMI counts for each cell were normalized by the total UMI counts, multiplied by a scale factor of 10 000, and then log transformed. To reduce data dimensionality, principal component analysis based on 914 variable genes detected by Seurat was performed on the normalized UMI counts. The tSNE analysis24 and cell clustering were performed based on the first 50 features obtained by principal component analysis. Cluster‐specific marker genes were identified by 2 criteria: (i) detection in >50% of cells in a specific cluster; and (ii) normalized UMI counts in the cluster of cells of >2‐fold that in the remaining cells.
2.8. Statistical analyses
Experiment data were expressed as means + SEM; n is the number of independent experiments conducted. Comparative analyses of the data on RTV, ΔT/C and frequency of objective response (CR + PR) were performed by Dunnett's multiple comparisons test, Sidak's multiple comparisons test and Fisher's exact test, respectively. GraphPad Prism 7 software was used for all statistical analyses. P‐values <.05 were considered statistically significant.
3. RESULTS
3.1. Antitumor activities of lenvatinib and sorafenib in Hepa1‐6 mouse hepatocellular carcinoma syngeneic tumor models
To profile immune cell populations in the Hepa1‐6 tumor model using syngeneic C57L/J mice, we examined the proportions of immune cell populations and the expression levels of immune checkpoint receptors on T cells by using FCM analysis followed by viSNE analysis (Figure 1A). In CD45+ tumor infiltrating lymphocytes (TILs), around 30% of cells were CD3+ T cells (Figure 1B). Among them, almost all cells were CD8+ cytotoxic T cells; therefore, the ratio of CD4+ helper T cells to CD8+ cytotoxic T cells was very low in this model. In addition, PD‐1 was expressed in most CD8+ cytotoxic T cells, and T‐cell membrane protein 3 (TIM‐3) was expressed in half the CD8+ T cells (Figure 1C). These data indicate that the Hepa1‐6 tumor is a T cell‐inflamed tumor.
Figure 1.
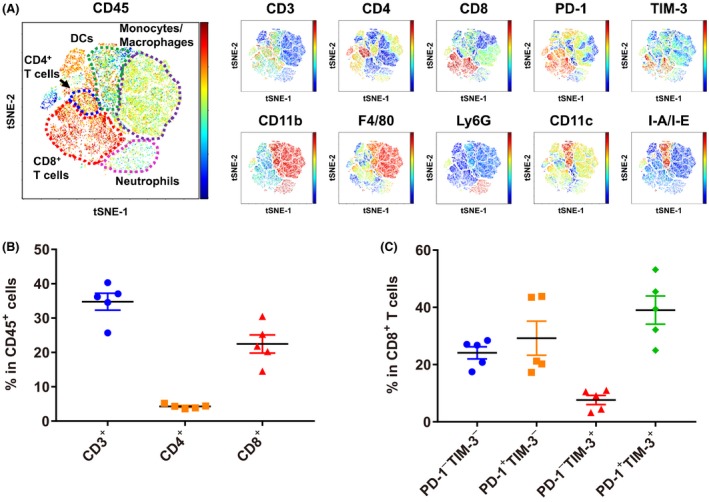
Characterization of immune cell populations in the Hepa1‐6 tumor model in C57L/J mice. A, Tumor‐infiltrating lymphocytes from Hepa1‐6 syngeneic mice were examined by flow cytometry analysis followed by viSNE analysis. For each molecule examined, the expression level in individual cells is indicated by the right color bar (red: high, blue: low). Representative data are shown (n = 5). B, Percentages of CD3+, CD4+ or CD8+ T cells in CD45+ cells are shown. C, Percentages of PD‐1+/− TIM‐3+/− cells in CD8+ T cells are shown. Data are shown as means ± SEM. The data shown are representative of 2 independent experiments
To investigate the antitumor activities of lenvatinib and sorafenib, we first examined the cell growth inhibitory activities of both drugs against Hepa1‐6 cells in an in vitro proliferation assay and confirmed that neither has potent direct cell growth inhibitory activities: IC50 values of lenvatinib and sorafenib were >30 and 9.7 μmol/L, respectively (Figure S1), which are not clinically meaningful concentrations.25, 26 We next assessed the antitumor activities of lenvatinib and sorafenib by using immunocompetent and immunodeficient mice in the Hepa1‐6 model to investigate involvement of the immune system in the antitumor activity of each drug. In immunocompetent C57L/J mice, lenvatinib almost completely suppressed in vivo growth of Hepa1‐6 tumors, whereas sorafenib only slowed in vivo tumor growth compared to the non‐treatment control; thus, the antitumor activity of lenvatinib was significantly more potent than that of sorafenib in the immunocompetent Hepa1‐6 tumor model (Figure 2A). In contrast, when Hepa1‐6 cells were inoculated into immunodeficient CAnN.Cg‐Foxn1nu/CrlCrlj mice, tumor growth was not significantly different between mice treated with lenvatinib and those treated with sorafenib (Figure 2B); thus, the 2 drugs showed similar potency to each other in this immunodeficient microenvironment. In all experiments, neither drug resulted in notable changes in relative body weight (Figure S2). The antitumor activity of sorafenib was almost comparable between immunocompetent and immunodeficient mouse models at day 8 (ΔT/C [%]: 62.3% and 53.8%, respectively) and at day 15 (39.7% and 37.5%, respectively) (Figure 2C). In contrast, the antitumor activity of lenvatinib was significantly enhanced in immunocompetent mice (day 8, −33.6%; day 15, −28.1%) compared with immunodeficient mice (day 8, 47.4%; day 15, 36.4%). These results show that lenvatinib has immunomodulatory activity that enhances antitumor activity under the immunocompetent tumor microenvironment in the Hepa1‐6 syngeneic mouse model.
Figure 2.
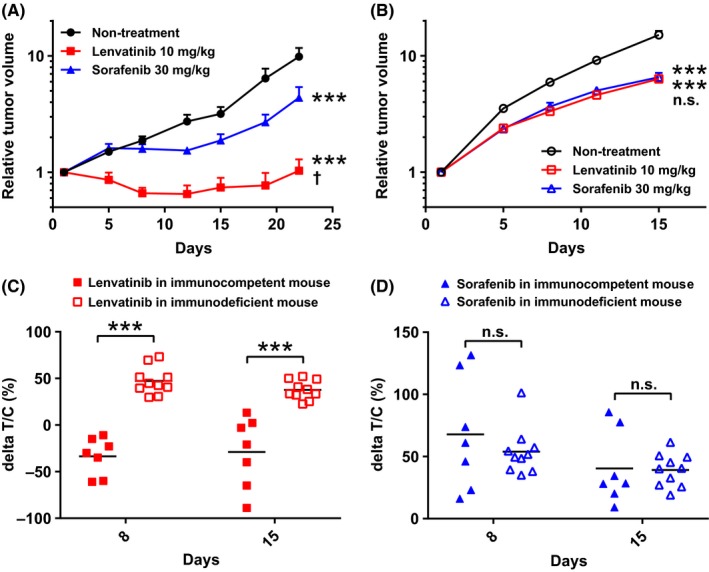
Antitumor activities of lenvatinib and sorafenib in Hepa1‐6 mouse tumor models. Mice were orally administered 10 mg/kg of lenvatinib or 30 mg/kg of sorafenib once daily, or subjected to non‐treatment (control). The day on which treatment commenced was designated as day 1. Relative tumor volumes of (A) Hepa1‐6 tumor model in immunocompetent mice, C57L/J (n = 7) or (B) Hepa1‐6 tumor model in immunodeficient mice (n = 10). Data are shown as means + SEM. ***P < .001 vs non‐treatment control; †P < .05, n.s., not significant between lenvatinib and sorafenib (Dunnett's multiple comparisons test). C, Antitumor activities shown as ΔT/C values of lenvatinib and sorafenib in Hepa1‐6 mice tumor models at days 8 and 15. ***P < .001, n.s., not significant between immunocompetent and immunodeficient mice (Sidak's multiple comparisons test). The data shown are representative of 2 independent experiments
3.2. Attenuation of antitumor activity of lenvatinib in the CD8+ T cell‐depleted Hepa1‐6 tumor model in syngeneic C57L/J mice
Because of our findings that: (i) the Hepa1‐6 tumors had a T cell‐inflamed microenvironment; and (ii) lenvatinib caused tumor regression of Hepa1‐6 tumors in immunocompetent C57L/J mice only, we hypothesized that lenvatinib might activate CD8+ T cells via immunomodulatory activity. To test this hypothesis, we investigated the antitumor activities of lenvatinib and sorafenib by using the Hepa1‐6 tumor model in C57L/J mice treated with anti‐CD8 Ab. Following intraperitoneal injection of anti‐CD8 Ab, CD8+ T cells were clearly depleted as expected (Figure S3), and in vivo Hepa1‐6 tumor growth was markedly increased compared with control IgG administered mice in the non‐treatment group (Figure S4). The ΔT/C values of lenvatinib in control IgG‐treated mice were significantly smaller than those of the CD8+ T cell‐depleted mice (Figure 3) at each time point examined (days 8, 15 and 22). In contrast, the ΔT/C values of sorafenib in control IgG‐treated mice were not significantly different from those of the CD8+ T cell‐depleted mice at any of the time points. These results suggest that the antitumor activity of lenvatinib is enhanced by its immunomodulatory activity via CD8+ T cells in the Hepa1‐6 tumor model in C57L/J mice.
Figure 3.
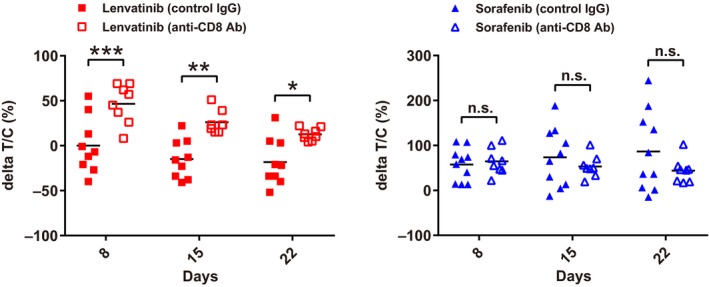
Antitumor activities of lenvatinib and sorafenib in Hepa1‐6 tumor model in C57L/J mice with CD8+ T cell depletion. ΔT/C values at days 8, 15 and 22 (mouse isotype control IgG [control IgG], n = 9‐10; anti‐CD8α antibody [anti‐CD8 Ab], n = 8). ***P < .001, **P < .01, *P < .05, n.s., not significant between control IgG and anti‐CD8 Ab treated mice (Sidak's multiple comparisons test). The data shown are representative of 2 independent experiments
3.3. Antitumor activities of lenvatinib in combination with anti‐mouse PD‐1 antibody in the Hepa1‐6 mouse hepatocellular carcinoma syngeneic tumor model
Because lenvatinib showed antitumor activity with its immunomodulatory activity via CD8+ T cells, we considered that combination treatment of lenvatinib plus an immune checkpoint inhibitor such as anti‐PD‐1 Ab may exert a synergistic antitumor activity. We therefore investigated the antitumor activity of treatment with lenvatinib plus anti‐PD‐1 Ab in the Hepa1‐6 tumor model. Anti‐PD‐1 Ab inhibited tumor growth compared with the non‐treatment control, and lenvatinib almost completely inhibited tumor growth, leading to dormant tumors (Figure 4A). The combination of lenvatinib plus anti‐PD‐1 Ab caused tumor regression and, thus, showed the most potent antitumor activity. Although antitumor activities varied among individual mice, tumors regressed to nonpalpable sizes in some mice treated with lenvatinib plus anti‐PD‐1 Ab (Figure 4B). The relative body weight of the animals was not significantly changed over treatments at comparable time points, indicating that the combination treatment was as tolerable as each treatment alone (Figure S5). When we evaluated antitumor activities of the treatments by using the modified RECIST criteria, the ORR of lenvatinib plus anti‐PD‐1 Ab was 66.7%, which is clearly superior to the ORR values of lenvatinib alone and anti‐PD‐1 Ab alone (both 13.3%) (Table S2). Thus, combination of lenvatinib plus anti‐PD‐1 Ab showed superior antitumor activity with the immune‐activating effect of anti‐PD‐1 Ab.
Figure 4.
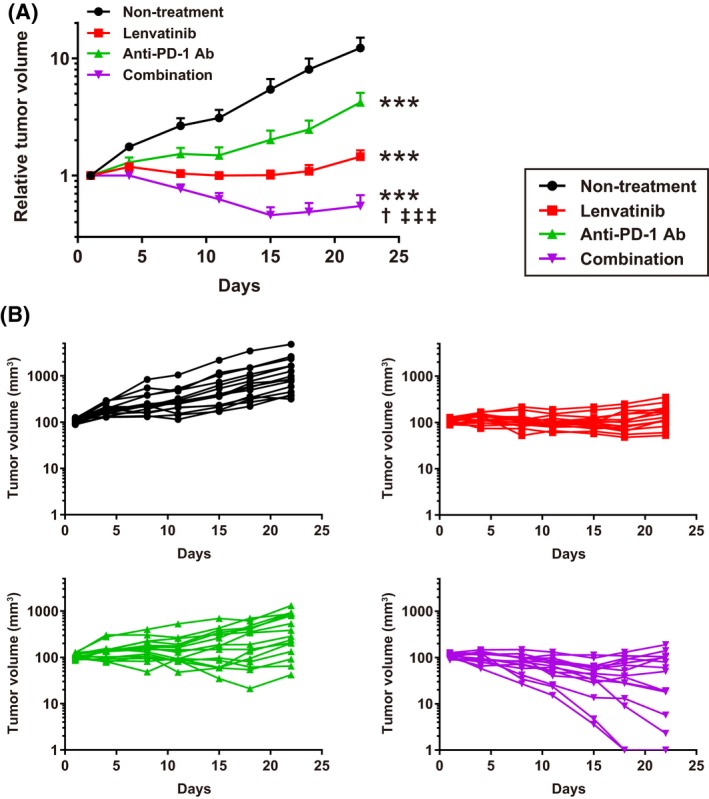
Antitumor activities of lenvatinib, anti‐mouse PD‐1 antibody (anti‐PD‐1 Ab), and combination of lenvatinib plus anti‐PD‐1 Ab in Hepa1‐6 mouse tumor models. Mice were orally administered 10 mg/kg of lenvatinib once daily, intraperitoneally injected with 200 μg/head of anti‐PD‐1 Ab twice weekly, subjected to a combination of both treatments, or subjected to non‐treatment (control). A, Relative tumor volume at indicated time points (n = 15). Data are shown as means + SEM. ***P < .001 vs non‐treatment control; †P < .05 vs lenvatinib; ‡‡‡P < .001 vs anti‐PD‐1 Ab (Dunnett's multiple comparisons test). B, Spider plots of each individual mouse's tumor volume in each group. Nonpalpable size tumors were defined as 1 mm3 tumor volume in the graph. The data shown are representative of 2 independent experiments
3.4. Population analysis of immune cells in Hepa1‐6 mouse hepatocellular carcinoma syngeneic tumor model after treatment with lenvatinib, anti‐mouse PD‐1 antibody or both combined
To investigate the effects of lenvatinib, anti‐PD‐1 Ab and both combined on immune cells in tumors, scRNA‐seq analysis was conducted using isolated immune cells in tumor tissues collected from Hepa1‐6 syngeneic mice. A total of 7456 cells (non‐treatment, 2108 cells; lenvatinib, 1729 cells; anti‐PD‐1 Ab, 1869 cells; and lenvatinib plus anti‐PD‐1 Ab, 1750 cells) passed data quality control. The median number of genes and UMI counts detected per cell were 1603.5 and 4680.5, respectively. There was no marked difference in the number of genes and UMI counts between the 4 treatment conditions (Figure S6). Clustering analysis revealed that the single cells could be classified into 17 clusters (C1‐C17) when the Seurat resolution parameter was set to .7 (Figure 5A). Based on the expression levels of major immune cell markers (Figure 5B) and the top 10 genes that were specifically expressed in each cluster (Figure 5C), we defined 9 immune cell populations from 15 clusters (Tables 1, S3). First, 7 immune cell populations were defined as shown in Figure 5A: CD8+ T cells (Cd3+Cd8+), CD4+ T cells (Cd3+Cd4+), regulatory T (Treg) cells (Cd3+Cd4+Foxp3+), natural killer (NK) cells (Cd3−Ncr1+), monocytes and macrophages (Csf1r+Itgam+), dendritic cells (DCs) (Cd74+H2‐Ab1+Ccl22+Ccl17+) and neutrophils (Csf3r+Cd33+). Then the 4 clusters of CD8+ T cells (C1‐C4; Figure 5A) were separated into 3 populations based on the expression levels of activation/exhaustion markers such as Pdcd1, Lag3, Gzmb and Cd69: Clusters C1 and C4 were exhausted CD8+ T cells (Pdcd1highLag3high), C2 consisted of effector CD8+ T cells (Pdcd1midLag3midGzmb+) and C3 consisted of early activated CD8+ T cells (Pdcd1lowLag3lowCd69+).
Figure 5.
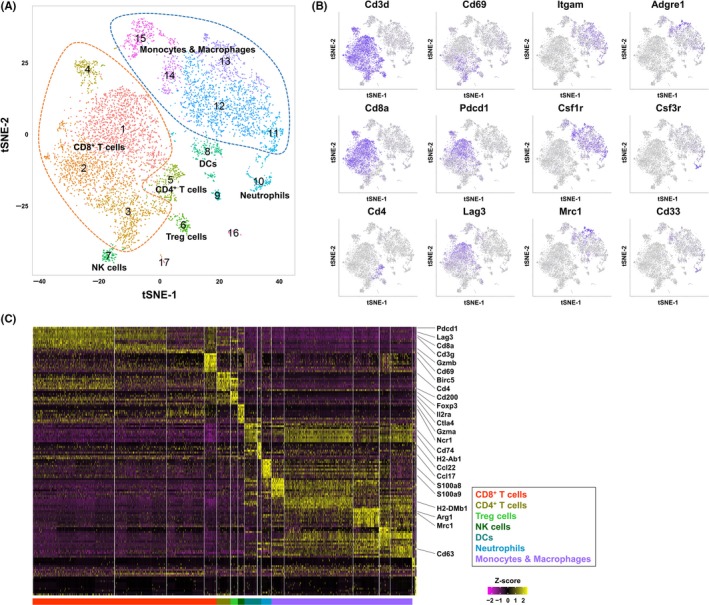
Immune cell population analysis in Hepa1‐6 syngeneic mouse tumors by single‐cell RNA sequencing. A, Two‐dimensional tSNE plot depicting 7456 single cells, each classified into 1 of the 17 clusters shown with distinct colors. CD8+ T cells, and monocytes and macrophages were surrounded by orange and blue broken lines, respectively. B, tSNE projection for 12 representative cell markers used for defining cell types of clusters. Each cell is colored by expression of the marker gene, with deep purple indicating high normalized unique molecular identifier. C, Heatmap of scaled gene expressions of the top 10 cluster‐specific genes detected from each cluster. Each row represents 1 gene and each column shows 1 cell ordered by cluster number
Table 1.
Change in proportion of each immune cell cluster among 3 treatment groups (lenvatinib; anti‐mouse PD‐1 antibody [anti‐PD‐1 Ab]; and lenvatinib plus anti‐PD‐1 Ab [combination]) compared to non‐treatment
| Lenvatinib | Anti‐PD‐1 Ab | Combination | |
|---|---|---|---|
| Exhausted CD8+ T cells (C1, C4) | −.42 | −2.64 | −1.41 |
| Effector CD8+ T cells (C2) | 2.53 | 2.17 | 4.47 |
| Early activated CD8+ T cells (C3) | 1.65 | 1.25 | 4.74 |
| CD4+ T cells (C5) | 1.62 | .32 | .93 |
| Treg cells (C6) | −.28 | .1 | 1.13 |
| NK cells (C7) | .71 | .95 | .4 |
| DCs (C8, C9) | −2.84 | −1.08 | −2.42 |
| Neutrophils (C10) | 3.82 | −.37 | 2.1 |
| Monocytes and macrophages (C11‐15) | −6.54 | −.5 | −10.32 |
The proportion of each cell cluster was defined as the ratio of the number of cells in the cluster to the total number of cells in the group (Table S3). The change in the proportion of each cell cluster was then calculated by subtracting the proportion for the same cell cluster in the non‐treatment control. Values show percent (%) change.
Next, we compared the proportions of immune cell populations in each treatment group with those in the non‐treatment control (Tables 1, S3). Following treatment with lenvatinib alone and treatment with lenvatinib plus anti‐PD‐1 Ab, the percentage of monocytes and macrophages (Csf1r+Itgam+) (C11‐C15) decreased by 6.54% and 10.32%, respectively, compared with the non‐treatment control. In addition, compared with non‐treatment, treatment with lenvatinib plus anti‐PD‐1 Ab increased the percentage of early activated CD8+ T cells (Pdcd1lowLag3lowCd69+) (C3) by 4.74% and effector CD8+ T cells (Pdcd1midLag3midGzmb+) (C2) by 4.47%.
Taken together, these findings indicate that lenvatinib alone decreased the proportion of monocytes and macrophages, and lenvatinib may be associated with further decreases in these populations when given in combination with anti‐PD‐1 Ab. In contrast, combination of lenvatinib plus anti‐PD‐1 Ab increased the proportion of early activated CD8+ T cells and effector CD8+ T cells.
4. DISCUSSION
In this study, we used the Hepa1‐6 tumor model in C57L/J mice as an HCC syngeneic model22, 23 to investigate the role of the immunomodulatory activity of lenvatinib in its antitumor activity. FCM analysis followed by viSNE analysis revealed that the CD8+ T cell population accounted for approximately 30% of CD45+ TILs in Hepa1‐6 tumor tissues, and many CD8+ T cells expressed immune checkpoint receptors such as PD‐1 and TIM‐3. Because CD8+ T cells with dual expression of PD‐1 and TIM‐3 are known to exhibit the most severe exhausted phenotype,27 our results indicate that the CD8+ T cells in the Hepa1‐6 tumor tissues had already been activated more than once by neo‐antigens derived from Hepa1‐6 tumor tissues before drug treatment. This immune active phenotype of the Hepa1‐6 tumor model was consistent with the significant increase in tumor growth rate observed in the CD8+ T cell‐depleted condition. Based on these data, we consider that the Hepa1‐6 syngeneic mouse tumor model is a T cell‐inflamed HCC preclinical model that can be used to examine the immunomodulatory effect of lenvatinib on antitumor immunity. In fact, the inflamed tumor phenotype likely exists as the minority of HCC.28
We previously observed that lenvatinib modulates the cancer immunity associated with a decrease in tumor‐associated macrophages and an increase in interferon‐gamma production in CD8+ T cells in a CT26 mouse colorectal cancer syngeneic tumor model (Y. Kato, K. Tabata, unpublished data). Therefore, we used the Hepa1‐6 syngeneic mouse tumor model to investigate the antitumor and immunomodulatory activities of lenvatinib compared with sorafenib, which has been the standard of care drug for first‐line advanced HCC. We demonstrated that antitumor activities of lenvatinib and sorafenib were comparable in a Hepa1‐6 mouse HCC tumor model using immunodeficient mice, but the antitumor activity of lenvatinib was more potent than that of sorafenib in a Hepa1‐6 tumor model using immunocompetent mice. In addition, the antitumor activity of lenvatinib, but not of sorafenib, was significantly diminished by CD8+ T cell depletion. These data indicate that lenvatinib displayed immunomodulatory activity, especially on the CD8+ T cell population, and that this effect contributed to potent antitumor activity of lenvatinib under the immunocompetent condition. Although the details of the immune activation mechanism of lenvatinib are still unclear, the different effects on cancer immunity between lenvatinib and sorafenib might be caused by differences in their diverse kinase inhibition profiles.6 Compared with sorafenib, lenvatinib has more potent inhibitory activities against VEGFRs and FGFRs. Inhibition of these pathways may improve cancer immunity in the tumor microenvironment, because VEGFRs and FGFRs signals play suppressive roles in immune responses.29, 30, 31, 32 In particular, VEGF is a well‐characterized immunosuppressive factor.33 Accumulating evidence suggests that VEGF inhibits the maturation and activity of immune cell populations such as T cells and DCs, but it remains unknown whether inhibition of VEGF signaling alone is sufficient to activate anticancer immunity. In immunodeficient mice, lenvatinib and sorafenib showed similar antitumor activities, mainly through the inhibition of angiogenesis targeting VEGF receptors; however, only lenvatinib showed enhanced antitumor activity in immunocompetent mice via CD8+ T cells. Further investigations are needed to understand whether this difference in the induction of antitumor immunity by lenvatinib and sorafenib is caused by differences in the degree of inhibition of the VEGFR signaling pathway, by differences in the targeting of other kinases such as FGFR, or by a combination of these 2 factors.
Hepatocellular carcinoma is known as an immune tolerant malignancy. During chronic inflammation of the liver due to chronic hepatitis B or C, which are known HCC risk factors, immune inhibitory molecules such as PD‐1 are overexpressed and induce exhaustion of activated CD8+ T cells.34, 35 Moreover, it has been reported that increased expression of PD‐1 in CD8+ T cells is strongly associated with poorer disease outcomes and higher recurrence rates in patients with HCC.36 In fact, an anti‐PD‐1 Ab, nivolumab, showed clinically meaningful responses in patients with HCC in a phase 1/2 study (NCT01658878). Although inhibition of immune checkpoint molecules such as CTLA‐4, PD‐1 and PD‐L1 is an effective strategy, the clinical benefits of immune checkpoint inhibitors are still limited even in T cell‐inflamed tumors.37, 38, 39 Combination of immune checkpoint inhibitors with an angiogenesis inhibitor is an attractive way to improve immunotherapy outcome because many angiogenic molecules such as VEGFs, angiopoietins and PDGFs have immunosuppressive functions.40 Therefore, we assessed whether lenvatinib can enhance antitumor activity of anti‐PD‐1 Ab through its immunomodulatory effect in the Hepa1‐6 HCC tumor model. Although antitumor activity of anti‐PD‐1 Ab alone was partial, treatment with lenvatinib plus anti‐PD‐1 Ab significantly reduced the tumor volume compared with each treatment alone in the Hepa1‐6 HCC tumor model, and even regressed the tumors to nonpalpable sizes in some cases. This finding supports the rationale for using this combination treatment in a clinical trial for patients with HCC. Currently, phase 1b/2 trials of combination treatment of lenvatinib and anti‐PD‐1 Ab in patients with HCC are in progress (NCT03006926, NCT03418922).
In this study, scRNA‐seq analysis of TILs in Hepa1‐6 tumor tissues revealed that lenvatinib decreased the proportion of monocytes and macrophages. Moreover, the combination of lenvatinib plus anti‐PD‐1 Ab increased the proportion of early activated and effector CD8+ T cells. We therefore hypothesize that lenvatinib and the combination of lenvatinib plus anti‐PD‐1 Ab activate CD8+ T cells in the Hepa1‐6 mouse tumor model, and that this activation is associated with a decrease in the proportion of monocytes and macrophages, which are cells known to play a role in suppressing cancer immunity.41, 42 Lenvatinib, which is a potent VEGFRs inhibitor, may depress suppressive immune cell populations such as tumor‐associated macrophages and activate tumor‐directed T cell responses, because VEGF signaling is important for these kinds of immature myeloid cells to multiply and infiltrate into tumor tissues.43, 44 However, further analyses are needed to investigate the precise mode of action of lenvatinib on various immune cell populations, especially those defined by expression levels of marker genes in our study.
In conclusion, we found that the antitumor activity of lenvatinib is dependent on the existence of CD8+ T cells, and combination treatment of lenvatinib plus anti‐PD‐1 Ab significantly reduces tumor volume and shows superior antitumor activity compared with either single treatment in the T cell‐inflamed mouse syngeneic Hepa1‐6 HCC tumor model. These results indicate that lenvatinib has immunomodulatory activity, which enhances its antitumor activity, and that treatment with lenvatinib plus anti‐PD‐1 Ab may be a promising combinatorial strategy for immune‐based cancer therapy. Further clinical investigation of combination treatment with lenvatinib plus anti‐PD‐1 Ab is in progress as a potential therapeutic strategy for patients with HCC.
CONFLICT OF INTEREST
All authors are employees of Eisai.
Supporting information
ACKNOWLEDGEMENTS
We gratefully acknowledge Taisuke Uehara, Taro Semba, Hajime Shimizu, Hideki Watanabe, Yusuke Adachi, Masahiro Matsuki, Taisuke Hoshi, Saori Watanabe‐Miyano, Tomohiro Matsushima, Akira Yokoi, Yukinori Minoshima and Yusuke Nakatani (Eisai) for the advice and support we received in conducting this study, Kaeko Tanaka for supporting the FCM analysis, and Sunplanet for supporting the animal studies.
Kimura T, Kato Y, Ozawa Y, et al. Immunomodulatory activity of lenvatinib contributes to antitumor activity in the Hepa1‐6 hepatocellular carcinoma model. Cancer Sci. 2018;109:3993–4002. 10.1111/cas.13806
Takayuki Kimura and Yu Kato contributed equally to this work.
Contributor Information
Junji Matsui, Email: Junji_Matsui@eisai.com.
Yasuhiro Funahashi, Email: y-funahashi@hhc.eisai.co.jp.
References
- 1. Llovet JM, Zucman‐Rossi J, Pikarsky E, et al. Hepatocellular carcinoma. Nat Rev Dis Primers. 2016;2:16018. [DOI] [PubMed] [Google Scholar]
- 2. McGlynn KA, Petrick JL, London WT. Global epidemiology of hepatocellular carcinoma: an emphasis on demographic and regional variability. Clin Liver Dis. 2015;19:223‐238. [DOI] [PMC free article] [PubMed] [Google Scholar]
- 3. Torre LA, Bray F, Siegel RL, Ferlay J, Lortet‐Tieulent J, Jemal A. Global cancer statistics, 2012. CA Cancer J Clin. 2015;65:87‐108. [DOI] [PubMed] [Google Scholar]
- 4. Wong MC, Jiang JY, Goggins WB, et al. International incidence and mortality trends of liver cancer: a global profile. Sci Rep. 2017;7:45846. [DOI] [PMC free article] [PubMed] [Google Scholar]
- 5. Llovet JM, Ricci S, Mazzaferro V, et al. Sorafenib in advanced hepatocellular carcinoma. N Engl J Med. 2008;359:378‐390. [DOI] [PubMed] [Google Scholar]
- 6. Tohyama O, Matsui J, Kodama K, et al. Antitumor activity of lenvatinib (E7080): an angiogenesis inhibitor that targets multiple receptor tyrosine kinases in preclinical human thyroid cancer models. J Thyroid Res. 2014;2014:638747. [DOI] [PMC free article] [PubMed] [Google Scholar]
- 7. Ichikawa K, Miyano‐Watanabe S, Adachi Y, et al. Lenvatinib suppresses angiogenesis through the inhibition of both the VEGFR and FGFR signaling pathways. Glob J Cancer Ther. 2016;2:019‐025. [Google Scholar]
- 8. Matsuki M, Hoshi T, Yamamoto Y, et al. Lenvatinib inhibits angiogenesis and tumor fibroblast growth factor signaling pathways in human hepatocellular carcinoma models. Cancer Med. 2018;7(6):2641‐2653. [DOI] [PMC free article] [PubMed] [Google Scholar]
- 9. Matsuki M, Adachi Y, Ozawa Y, et al. Targeting of tumor growth and angiogenesis underlies the enhanced antitumor activity of lenvatinib in combination with everolimus. Cancer Sci. 2017;108:763‐771. [DOI] [PMC free article] [PubMed] [Google Scholar]
- 10. Schlumberger M, Tahara M, Wirth LJ, et al. Lenvatinib versus placebo in radioiodine‐refractory thyroid cancer. N Engl J Med. 2015;372:621‐630. [DOI] [PubMed] [Google Scholar]
- 11. Motzer RJ, Hutson TE, Glen H, et al. Lenvatinib, everolimus, and the combination in patients with metastatic renal cell carcinoma: a randomised, phase 2, open‐label, multicentre trial. Lancet Oncol. 2015;16:1473‐1482. [DOI] [PubMed] [Google Scholar]
- 12. Kudo M, Finn RS, Qin S, et al. Lenvatinib versus sorafenib in first‐line treatment of patients with unresectable hepatocellular carcinoma: a randomised phase 3 non‐inferiority trial. Lancet. 2018;391(10126):1163‐1173. [DOI] [PubMed] [Google Scholar]
- 13. Garon EB, Rizvi NA, Hui R, et al. Pembrolizumab for the treatment of non‐small‐cell lung cancer. N Engl J Med. 2015;372:2018‐2028. [DOI] [PubMed] [Google Scholar]
- 14. Robert C, Schachter J, Long GV, et al. Pembrolizumab versus ipilimumab in advanced melanoma. N Engl J Med. 2015;372:2521‐2532. [DOI] [PubMed] [Google Scholar]
- 15. Gao Q, Qiu SJ, Fan J, et al. Intratumoral balance of regulatory and cytotoxic T cells is associated with prognosis of hepatocellular carcinoma after resection. J Clin Oncol. 2007;25:2586‐2593. [DOI] [PubMed] [Google Scholar]
- 16. Chew V, Tow C, Teo M, et al. Inflammatory tumour microenvironment is associated with superior survival in hepatocellular carcinoma patients. J Hepatol. 2010;52:370‐379. [DOI] [PubMed] [Google Scholar]
- 17. Sangro B, Gomez‐Martin C, de la Mata M, et al. A clinical trial of CTLA‐4 blockade with tremelimumab in patients with hepatocellular carcinoma and chronic hepatitis C. J Hepatol. 2013;59:81‐88. [DOI] [PubMed] [Google Scholar]
- 18. El‐Khoueiry AB, Sangro B, Yau T, et al. Nivolumab in patients with advanced hepatocellular carcinoma (CheckMate 040): an open‐label, non‐comparative, phase 1/2 dose escalation and expansion trial. Lancet. 2017;389:2492‐2502. [DOI] [PMC free article] [PubMed] [Google Scholar]
- 19. Iñarrairaegui M, Melero I, Sangro B. Immunotherapy of hepatocellular carcinoma: facts and hopes. Clin Cancer Res. 2018;24:1518‐1524. [DOI] [PubMed] [Google Scholar]
- 20. Gao H, Korn JM, Ferretti S, et al. High‐throughput screening using patient‐derived tumor xenografts to predict clinical trial drug response. Nat Med. 2015;21:1318‐1325. [DOI] [PubMed] [Google Scholar]
- 21. Therasse P, Arbuck SG, Eisenhauer EA, et al. New guidelines to evaluate the response to treatment in solid tumors. European Organization for Research and Treatment of Cancer, National Cancer Institute of the United States, National Cancer Institute of Canada. J Natl Cancer Inst. 2000;92:205‐216. [DOI] [PubMed] [Google Scholar]
- 22. el Amir AD, Davis KL, Tadmor MD, et al. viSNE enables visualization of high dimensional single‐cell data and reveals phenotypic heterogeneity of leukemia. Nat Biotechnol. 2013;31:545‐552. [DOI] [PMC free article] [PubMed] [Google Scholar]
- 23. Gribov A, Sill M, Luck S, et al. SEURAT: visual analytics for the integrated analysis of microarray data. BMC Med Genomics. 2010;3:21. [DOI] [PMC free article] [PubMed] [Google Scholar]
- 24. Van Der Maaten L, Hinton G. Visualizing data using t‐SNE. J Mach Learn Res. 2008;9:2579‐2605. [Google Scholar]
- 25. Ikeda M, Okusaka T, Mitsunaga S, et al. Safety and pharmacokinetics of lenvatinib in patients with advanced hepatocellular carcinoma. Clin Cancer Res. 2016;22:1385‐1394. [DOI] [PubMed] [Google Scholar]
- 26. Strumberg D, Clark JW, Awada A, et al. Safety, pharmacokinetics, and preliminary antitumor activity of sorafenib: a review of four phase I trials in patients with advanced refractory solid tumors. Oncologist. 2007;12:426‐437. [DOI] [PubMed] [Google Scholar]
- 27. Sakuishi K, Apetoh L, Sullivan JM, Blazar BR, Kuchroo VK, Anderson AC. Targeting Tim‐3 and PD‐1 pathways to reverse T cell exhaustion and restore anti‐tumor immunity. J Exp Med. 2010;207:2187‐2194. [DOI] [PMC free article] [PubMed] [Google Scholar]
- 28. Sia D, Jiao Y, Martinez‐Quetglas I, et al. Identification of an immune‐specific class of hepatocellular carcinoma, based on molecular features. Gastroenterology. 2017;153:812‐826. [DOI] [PubMed] [Google Scholar]
- 29. Courau T, Nehar‐Belaid D, Florez L, et al. TGF‐beta and VEGF cooperatively control the immunotolerant tumor environment and the efficacy of cancer immunotherapies. JCI Insight. 2016;1:e85974. [DOI] [PMC free article] [PubMed] [Google Scholar]
- 30. Voron T, Colussi O, Marcheteau E, et al. VEGF‐A modulates expression of inhibitory checkpoints on CD8+ T cells in tumors. J Exp Med. 2015;212:139‐148. [DOI] [PMC free article] [PubMed] [Google Scholar]
- 31. Sweis RF, Spranger S, Bao R, et al. Molecular drivers of the non‐T‐cell‐inflamed tumor microenvironment in urothelial bladder cancer. Cancer Immunol Res. 2016;4:563‐568. [DOI] [PMC free article] [PubMed] [Google Scholar]
- 32. Welte T, Kim IS, Tian L, et al. Oncogenic mTOR signalling recruits myeloid‐derived suppressor cells to promote tumour initiation. Nat Cell Biol. 2016;18:632‐644. [DOI] [PMC free article] [PubMed] [Google Scholar]
- 33. Hato T, Zhu AX, Duda DG. Rationally combining anti‐VEGF therapy with checkpoint inhibitors in hepatocellular carcinoma. Immunotherapy. 2016;8:299‐313. [DOI] [PMC free article] [PubMed] [Google Scholar]
- 34. Fisicaro P, Valdatta C, Massari M, et al. Antiviral intrahepatic T‐cell responses can be restored by blocking programmed death‐1 pathway in chronic hepatitis B. Gastroenterology. 2010;138(682):93. 93.e1‐4. [DOI] [PubMed] [Google Scholar]
- 35. Nakamoto N, Cho H, Shaked A, et al. Synergistic reversal of intrahepatic HCV‐specific CD8 T cell exhaustion by combined PD‐1/CTLA‐4 blockade. PLoS Pathog. 2009;5:e1000313. [DOI] [PMC free article] [PubMed] [Google Scholar]
- 36. Shi F, Shi M, Zeng Z, et al. PD‐1 and PD‐L1 upregulation promotes CD8(+) T‐cell apoptosis and postoperative recurrence in hepatocellular carcinoma patients. Int J Cancer. 2011;128:887‐896. [DOI] [PubMed] [Google Scholar]
- 37. Sharma P, Hu‐Lieskovan S, Wargo JA, Ribas A. Primary, adaptive, and acquired resistance to cancer immunotherapy. Cell. 2017;168:707‐723. [DOI] [PMC free article] [PubMed] [Google Scholar]
- 38. Ayers M, Lunceford J, Nebozhyn M, et al. IFN‐gamma‐related mRNA profile predicts clinical response to PD‐1 blockade. J Clin Investig. 2017;127:2930‐2940. [DOI] [PMC free article] [PubMed] [Google Scholar]
- 39. Zhu AX, Finn RS, Edeline J, et al. Pembrolizumab in patients with advanced hepatocellular carcinoma previously treated with sorafenib (KEYNOTE‐224): a non‐randomised, open‐label phase 2 trial. Lancet Oncol. 2018;19:940‐952. [DOI] [PubMed] [Google Scholar]
- 40. Khan KA, Kerbel RS. Improving immunotherapy outcomes with anti‐angiogenic treatments and vice versa. Nat Rev Clin Oncol. 2018;15(5):310‐324. [DOI] [PubMed] [Google Scholar]
- 41. Pollard JW. Tumour‐educated macrophages promote tumour progression and metastasis. Nat Rev Cancer. 2004;4:71‐78. [DOI] [PubMed] [Google Scholar]
- 42. Coffelt SB, Chen YY, Muthana M, et al. Angiopoietin 2 stimulates TIE2‐expressing monocytes to suppress T cell activation and to promote regulatory T cell expansion. J Immunol. 2011;186:4183‐4190. [DOI] [PubMed] [Google Scholar]
- 43. Noy R, Pollard JW. Tumor‐associated macrophages: from mechanisms to therapy. Immunity. 2014;41:49‐61. [DOI] [PMC free article] [PubMed] [Google Scholar]
- 44. Varney ML, Johansson SL, Singh RK. Tumour‐associated macrophage infiltration, neovascularization and aggressiveness in malignant melanoma: role of monocyte chemotactic protein‐1 and vascular endothelial growth factor‐A. Melanoma Res. 2005;15:417‐425. [DOI] [PubMed] [Google Scholar]
Associated Data
This section collects any data citations, data availability statements, or supplementary materials included in this article.
Supplementary Materials