

Abstract
At the invasive front of adenocarcinomas, single cells and multicellular structures exist; the latter include glands and cell clusters, such as tumor buddings and poorly differentiated clusters. Recent reports suggest the importance of collective cell migration in metastasis; however, it is technically difficult to observe the movement of multicellular structures in vivo. We utilized MDCK cells as a model for epithelial cells and established a method to quantify their motility in 3D structures in vitro. A single MDCK cell grows as a cell cluster in the gel and later proliferates and forms a cyst. Active K‐RAS expression induced rotation of both the cell clusters and the cysts. The rotation speed of cell clusters was 4 times higher than that of cysts. The screening of inhibitors for their effects on cell clusters and cysts revealed that cyclin B1 and β‐catenin were the key molecules for their rotation, respectively. Regulators for cyst rotation, such as vorinostat and β‐catenin, were not effective for inducing cell cluster rotation. These results indicate that the signaling pathways of cell dynamics are different between cell clusters and cysts. As cell clusters are related to lymph node involvement and the prognosis of various carcinomas, our in vitro quantitative system may be useful for the screening of drugs to prevent lymphatic invasion.
Keywords: CCNB1, cell cluster, cyst, live imaging, quantification
1. INTRODUCTION
Metastasis is a complex multistep process that includes invasion, intravasation, survival and circulation in the vasculature, extravasation and proliferation in distant organs.1 During invasion, the first part of the metastatic process, 1 to several tumor cells escape from the primary tumor to the surrounding tissues; invasion might require epithelial‐mesenchymal transition, although this point has been a subject of debate.
Traditionally, the mechanisms of cancer invasion have been studied by examining the migration/invasion of individual cells, which has led to great progress in our understanding of leukocyte and fibroblast migration. More recently, the invasion of cancer cell clusters has been a focus.2 The best‐known examples of collective cell clusters at the invasive edge are the tumor buddings and poorly differentiated clusters (PDCs) in colorectal cancer (CRC). Tumor budding is defined as the formation of single cancer cell clusters of less than 5 cancer cells,3 whereas PDCs are cancer clusters composed of 5 or more cancer cells and lacking a gland‐like structure.4 Tumor budding in CRC is strongly predictive of lymph node metastases, recurrence and cancer‐related death at 5 years.5 The presence of PDCs was highly relevant not only to long‐term survival in patients with curative surgery,6 but also to the incidence of nodal involvement in early invasive CRC.7 Despite the importance of cell clusters for invasion/metastasis, no one has witnessed the buds/PDCs invading into the stroma or lymphatic vessels.
K‐RAS proteins operate as molecular switches in signal transduction pathways downstream of tyrosine kinases.8 Among RAS oncogenes, K‐RAS is the most frequently mutated in human tumors. A common single‐nucleotide K‐RAS mutation at codon 12, from glycine (G) to aspartate (D) or valine (V), causes the membrane‐associated K‐RAS to remain locked in the active form.9 K‐RAS mutation incidence varies widely among organs. For example, K‐RAS oncogenes are found in almost 90% of pancreatic cancers and are present in 50% of colon and 25% of lung adenocarcinomas.10 Tumor bud formation in CRCs was observed to be significantly higher in tumors with K‐RAS gene mutations.10 K‐RAS mutations were significantly associated with PDC grade; that is, 10 or more PDCs were observed under the objective lens of a ×20 microscopic field in each tumor.11 Again, the effects of active K‐RAS on cell dynamics remain to be determined.
Using GFP‐based FRET biosensors, we previously visualized the kinase activities of migrating cultured epithelial cells on the dish12 and of neutrophils in the mouse intestine.13 We also tried to visualize the migration of ileal epithelial cells engaged in ischemic‐injury repair in FRET biosensor‐expressing mice14 and found that the velocity of the epithelial cells in vivo was lower than that of the neutrophils.13 Due to the limitations of the current in vivo techniques, it is still challenging to observe the migration/invasion process of epithelial cancer cells in vivo.15
Three‐dimensional cell culture in a gel has been developed to reconstitute the in vivo microenvironment, allowing investigation of the morphogenesis of multicellular tissue architectures. The representative model for epithelial structure is a spherical cyst and tubular structures comprised of MDCK cells, a cell line derived from renal tubules.16 In this system, a single MDCK cell seeded on/in an ECM‐rich gel grows to form a cyst that comprises a monolayer of polarized cells surrounding a fluid‐filled lumen, which is similar to the epithelial structure in the human body. We have utilized an in vitro MDCK cystogenesis system to investigate the maintenance programs of the epithelial 3D structure17, 18, 19, 20, 21 and the morphological and signaling changes induced by oncogenic signals.22, 23 In this study, we utilized this system to reconstitute the cell cluster invasion triggered by active K‐RAS signaling. For this purpose, we here established quantitative methods to track the cell cluster dynamics in vitro.
2. MATERIALS AND METHODS
Cell cluster and mature cyst formation, inhibitors, RNA interference, total RNA preparation, reverse transcription and quantitative PCR, microarray and gene set enrichment analysis, immunostaining and immunofluorescence microscopy, and SDS‐PAGE and western blotting were carried out using standard protocols. For details on cells, as well as microscope and 3D imaging, imaging data analysis, see Data S1.
3. RESULTS
3.1. Rotation of a cell cluster
To quantify the cellular dynamics in three dimensions, we first established MDCK cells expressing Histone‐H1‐mCherry and GFP‐CAAX, which localize to the nucleus and the plasma membrane, respectively. The cells were seeded between Matrigel layers and observed using a confocal microscope (Figure 1A, upper panels and Movie S1). After obtaining a series of nucleus images, the centers of the individual nuclei were marked and followed (Figure 1A, lower panels). Using these trajectories, the velocity and direction of the individual cell movements were quantified. Cross‐products are sensitive to the order of multiplication. In this method, the values of (a × b) and (b × a) showed opposite directions (Figure 1B). The cross‐products of the cell cluster in Figure 1A were visualized in a movie (Figure 1C and Movie S2), and in a graph (Figure 1C, lower graph). The quantification indicated that MDCK cells periodically rotated.
Figure 1.
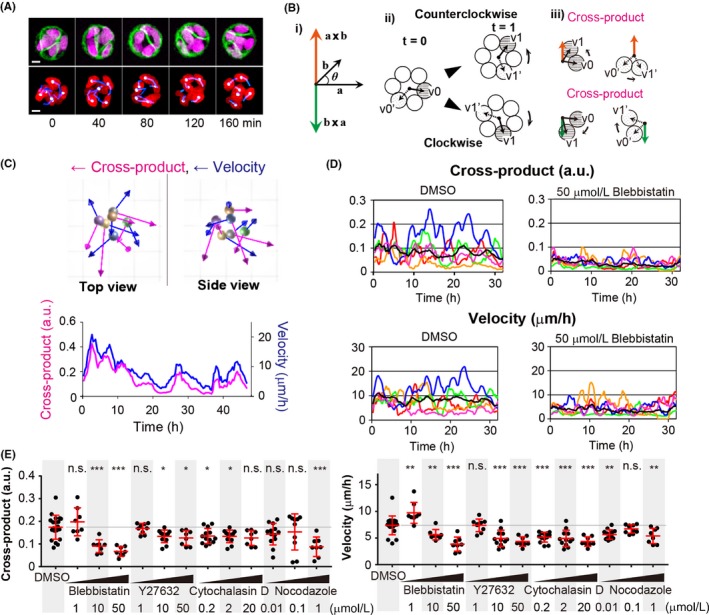
Quantification of single cell dynamics in a cell cluster in ECM. A, Representative images of an MDCK cell cluster in ECM. Upper panels, MDCK cells expressing GFP‐CAAX (green) and Histone H1‐mCherry (magenta) were seeded between Matrigel layers. Twenty‐four hours later, the cells were observed by fluorescent confocal microscopy. Images are the maximum intensity projection of each color. Lower panels, the nucleus (red), and tracked nuclei (white spheres) and tails of three previous positions (blue lines) are shown. Numbers at the bottom are time points (in minutes). Images are cropped from Movies S1 and S2. Scale bar = 10 μm. B, Schematic representation of the cross‐product calculation. (i) Cross‐products (orange and green arrows) were obtained by multiplication of a and b. The absolute values of the cross‐products (length of vectors with orange and green) are the same, but the direction of the vectors is opposite. (ii) Circles denote cells that form a cell cluster. At time point 0 (t = 0), the center of the cell cluster is expressed with a black dot, and the solid and dotted arrows connect the center of a cell cluster and cells. At time point 1 (t = 1), the cells migrate counterclockwise (upper panel) and clockwise (lower). (iii) As in (i), the cross‐products of each of the cells are expressed with arrows. C, Snapshot of a cell cluster in A (at time point 8 min). Cross‐products (blue arrows) and velocity (magenta arrows) of individual nuclei (colored sphere denotes the center positions of nuclei). The lower graph shows the averaged cross‐products and velocity in a cell cluster. D, A representative cell cluster cross‐product and velocity with DMSO and blebbistatin treatment. MDCK cells were imaged 36 h after seeding between Matrigel layers. Reagents indicated at the bottom were added to the media 1 h before imaging. Graphs show the average (black line) and five representative results (colored lines) from the experiment. E, Quantification of the cross‐product and velocity following inhibitor treatment. MDCK cells were treated with various inhibitors at various concentrations (indicated at the bottom). Dots represent individual cell clusters. The averages (red lines and gray line for the average from the DMSO‐treated group) were calculated from the values of the first 24 h of imaging. *P < .05, **P < .01 and ***P < .001, statistically significant by two‐tailed t test. n.s., not significant
As cytoskeletal rearrangements, such as actin and microtubule polymerization, regulate cell dynamics, we next examined the effects of various inhibitors on cell cluster rotation (Figure 1D,E). Results from the individual experiments are shown in Figure S1. Treatment of cytoskeletal inhibitors, such as blebbistatin (a myosin II inhibitor), Y27632 (a Rho associated coiled‐coil containing protein kinase inhibitor), cytochalasin D (an actin polymerization inhibitor) and nocodazole (a microtubule polymerization inhibitor), significantly inhibited cell cluster rotation in a dose‐dependent manner.
3.2. Acceleration of cell cluster rotation by the expression of active K‐RAS
We previously established a system to induce active K‐RAS expression using the auxin‐inducible degron (AID) system23, 24 (Figure 2A). In the presence of auxin, or a synthetic auxin, 1‐naphthaleneacetic acid (NAA), the transport inhibitor response‐1 (TIR1) plant F‐box protein binds to the AID protein, leading to polyubiquitination of AID proteins and thereby degradation of the AID protein by the proteasome.23 Thus, an AID‐tagged protein, such as AID‐K‐RASV12, should also be degraded in an auxin‐dependent manner. MDCK cells carrying TIR1 and AID‐KRASV12 were established and maintained in the presence of NAA,24 and Histone‐H1‐mCherry and GFP‐CAAX were introduced. As shown in Figure 2B and Movies S3 and S4, the expression of K‐RASV12 induced larger cross‐products. Quantification of the individual cluster movement clearly indicated that the active K‐RAS expression enhanced both the cross‐products and velocity, while the periods of rotation were comparable (Figure 2C). Figure 2D shows the averaged cross‐product and velocity of multiple cell clusters, indicating that the active K‐RAS significantly upregulated the cell cluster rotation.
Figure 2.
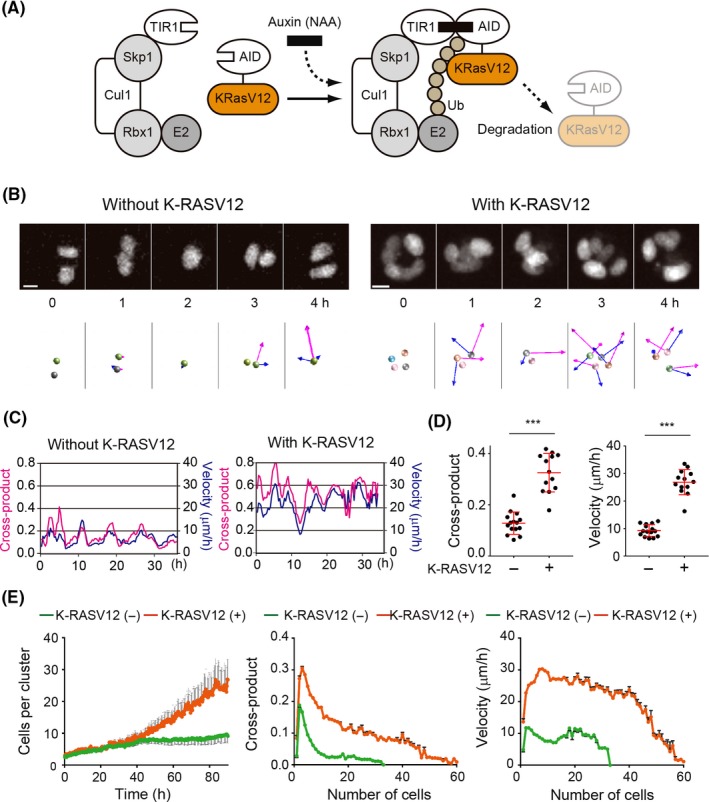
Acceleration of a cell cluster rotation by active K‐RAS. A, Schematic of the auxin‐inducible degron (AID) system. Auxin (indole‐3‐acetic acid) binding to transport inhibitor response‐1 (TIR1), a plant F‐box protein, promotes the interaction between TIR1 and the AID tag, which is derived from Arabidopsis thaliana. The Skip1‐Cul1‐Rbx1 complex bound to TIR acts as an E3 ubiquitin ligase to effect polyubiquitination of the AID‐tagged proteins, followed by proteasome‐mediated degradation. B, Representative time‐lapse images of MDCK cells without and with K‐RASV12. MDCK cells expressing GFP‐CAAX and Histone H1‐mCherry (without K‐RASV12) or AID‐K‐RASV12 and Histone H1‐mCherry (with K‐RASV12) were seeded between Matrigel layers and cultured for 36 h before imaging. The cross‐product (magenta arrows) and velocity (blue arrows) of the cells are processed as in Figure 1C. Images are cropped from Movies S3 and S4. Scale bar = 10 μm. C, Quantification of the cross‐product (blue) and velocity (magenta) of the cells in 2B. D, Quantification of the cross‐product (left) and velocity (right). Dots represent the averaged cross‐product and velocity of a cell cluster for 24 h of imaging. Red lines denote the averaged value from 15 cell clusters. ***P < .001, statistically significant by two‐tailed t test. Results shown here are representative of 3 experiments. E, Cell numbers (right), cross‐product per cell (middle) and velocity by cell numbers were analyzed from the data shown in D for MDCK cell clusters without and with K‐RASV12 expression (green and orange lines, respectively). Gray bars indicate SEM
As K‐RAS is a molecular switch located downstream of various growth factor receptors, it is plausible that changes in the cell numbers are responsible for the difference of cell movement. To investigate this possibility, we counted the number of cells per cluster and compared the cross‐product and velocity per cell in the absence and presence of the active K‐RAS. As shown in Figure 2E, during the first 40 hours of imaging, the cell numbers in both clusters were similar. After 40 hours, the K‐RAS‐expressing clusters proliferated more rapidly. As the values obtained in Figures 1 and 2 were from 20 hours of imaging, it is concluded that the accelerated cross‐product and velocity were not due to the increase of cell numbers. The peak of the cross‐product was at 2‐3 cells, after which it decreased with increasing cell number, while the velocity remained constant up to 30 cells. These results indicate that the expression of the active K‐RAS altered the character of the individual cells, and thereby the cell dynamics.
3.3. Requirement of cytoskeletal rearrangement and the RAF‐MAPK and PI3K pathways for cell cluster rotation
Previously, using effector‐specific mutants of K‐RASV12, we showed that the RAF and PI3K signaling pathways function cooperatively downstream of RAS for luminal cell filling.24 Those mutants, K‐RASV12‐T35S, ‐E37G and ‐Y40C, preferentially bind to and activate RAF, RALGEF and PI3K, respectively25 (Figure 3A). MDCK‐TIR1 was infected with retroviruses encoding the AID‐tagged‐RAS mutants and examined as described above. The RAF‐specific mutant T35S and RALGEF‐specific mutant E37G, but not Y40C, significantly induced upregulation of both the cross‐product and velocity, in a manner similar to K‐RASV12, albeit to a much lesser extent. Similarly, expression of the active form of MEK1 (MEK1SDSE), a downstream factor of RAF‐1, significantly but less effectively increased the cross‐product and velocity. These results indicate that the active K‐RAS utilized different downstream factors for different phenotypes, such as cell proliferation and rotation, or in the different stages of cell clusters.
Figure 3.
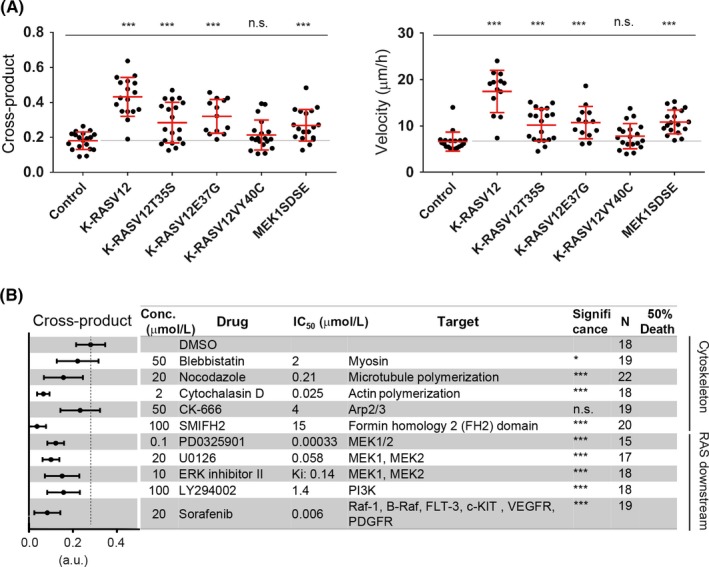
Requirement of downstream factors of active K‐RAS. A, MDCK cells expressing various auxin‐inducible degron (AID)‐tagged KRASV12 and MEK mutants (indicated at the bottom) were analyzed as in Figure 1D. MDCK cells expressing GFP‐CAAX and H1‐mCherry were used as a control. Averages (red lines) (gray line, average from the control group) were calculated from the data of the first 24 h of imaging. **P < .01, ***P < .001, statistically significant by two‐tailed t test. The result shown is representative of 2 independent experiments. n.s., not significant. B, MDCK cells expressing AID‐KRASV12 were processed and analyzed as shown in Figure 1D. In the left graph, the mean (black dot) and 95% confidence intervals of the SD (bars) are shown. Dotted line denotes the value of the control group (DMSO). **P < .01 and ***P < .001, significantly different from the control (DMSO) by two‐tailed t test. 50% Death, cell death judged by fluorescence disappearance based on observation by the eye; Conc., drug concentration; N, number of analyzed cell clusters; n.s., not significant
As cytoskeleton regulation was required for cell cluster rotation of the normal MDCK cells (Figure 1E), we treated K‐RASV12‐expressing clusters with inhibitors (Figure 3B). As a negative control, we treated the clusters with DMSO, a solvent for the drugs. As expected, blebbistatin, nocodazole and cytochalasin D significantly inhibited cell cluster rotation. For actin cytoskeleton, further specific inhibitors, CK‐66626 and SMIFH2,27 which specifically inhibit Arp2/3 and formin, respectively, were applied. Interestingly, SMIFH2, but not CK‐666, inhibited cell cluster rotation, suggesting that actin‐bundle formation is required for cell cluster rotation. As downstream factors of K‐RAS, three MEK‐ERK inhibitors inhibited cell cluster rotation. LY294002 treatment inhibited cell cluster rotations, indicating that activation of PI3K is required, but not sufficient for cell cluster rotation.
3.4. Requirement of cyclin B1 (CCNB1) for cell cluster rotation
As we were able to quantify the cell dynamics by our methods of cross‐product and velocity, we treated the MDCK cell clusters expressing K‐RASV12 with various inhibitors. Among them, some inhibitors against cyclin‐dependent kinases (CDKs) reduced cross‐products and velocity (data not shown). We next knocked down CDKs and cyclins in MDCK cells (Figure 4A). Cyclin‐dependent kinases are members of the Ser/Thr kinase subfamily. Cyclins are regulatory subunits that bind to the CDK, resulting in activation of the kinase. Most members of the CDK family form a CDK/cyclin (CCN) complex and are involved in regulation of the cell cycle.28 Against our expectation, downregulation of various CDKs had no effect on the cross‐product and velocity of cell clusters (Figure 4B); this might be due to the incomplete knockdown of CDKs in the cells (Figure 4A). In contrast, among various cyclins, the knockdown of CCNB1 reduced both cross‐product and velocity. Cyclin B1 is expressed in the late G2 to M phase of the cell cycle and regulates CDK1 activity and cell proliferation.28 As shown in Figure 4C, CCNB1 knockdown suppressed cell proliferation, but CDK1 knockdown did not. Of note, the knockdown of CDK9 and CCNA2 had also inhibited either the cross‐product or velocity to a lesser extent, even though the downregulation of each gene inhibited cell proliferation to a level similar to that of CCNB1. These results suggested that inhibition of cell proliferation per se was not sufficient to reduce cell cluster rotation.
Figure 4.
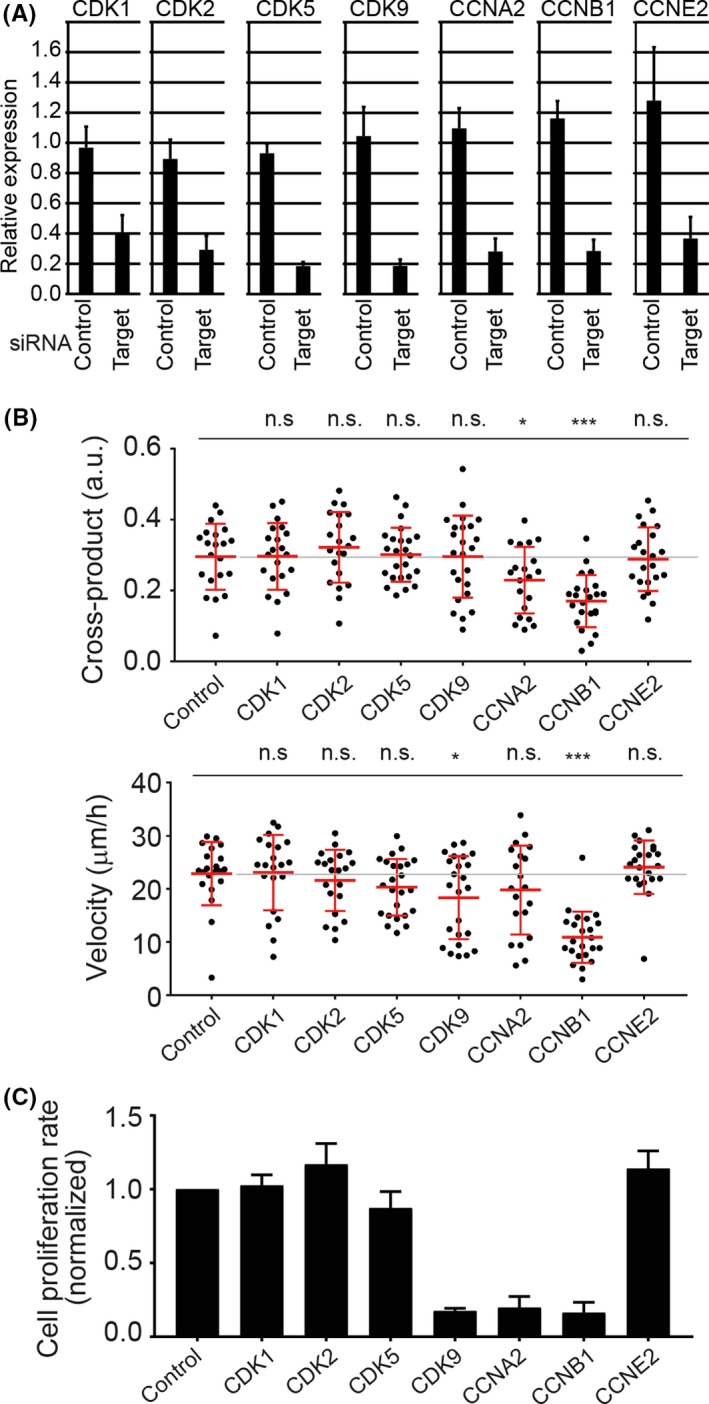
Requirement of cyclin B1 (CCNB1) for cell cluster rotation. A, mRNA expression of various genes following siRNA treatment. MDCK cells were treated with the indicated siRNA for 48 h. RNA was extracted and subjected to RT‐quantitative PCR. Relative expression of various mRNAs (indicated at the top) to the cells without siRNA treatment is shown. Average and SD were calculated from 4 independent experiments. Bars indicate SD. B, Quantification of the cross‐product and velocity following candidate siRNA knockdown. Dots represent individual cell clusters. Averages (red lines) (gray line, average from the DMSO‐treated group) were calculated from the data of the first 24 h of imaging. *P < .05, **P < .01, and ***P < .001, statistically significant by two‐tailed t test. n.s., not significant. C, Cell proliferation rates (number of cell proliferations per unit time and per cyst) following siRNA knockdown. Cell proliferation rates were acquired from the slope of the approximated line of the averaged time course of cell proliferation per cyst during the first 24 h from the start of observation. Values were obtained by normalization to the control value. Bars, SEM from 3 independent experiments
3.5. Mature cyst rotation by active K‐RAS and vorinostat
Previously, it has been reported that the rotational cell motion of MCF10A, a cell line derived from human mammary glands, was at its maximum 3‐4 days after embedding in Matrigel.29 As the velocity of cell cluster rotation was also reduced with time (Figure 2E), we examined the cell movement of mature cysts with K‐RASV12 expression. We defined cell clusters as cells cultured in the gel for 1.5 days, and mature cysts as cells cultured in the gel for 6 days at the time of imaging or nucleotide/protein examination (Materials and Methods). As shown in Figure 5A and Movie S5, the mature cysts rotate, but with less velocity (first row), and K‐RASV12 expression induced coherent rotation of a mature cyst (second row). This rotation was reduced by PD0325901 (an MEK inhibitor), LY294002 (a PI3K inhibitor) and Y27632 (a Rho associated coiled‐coil containing protein kinase inhibitor), which was also effective for cell cluster rotation (data not shown and Figures 1 and 2). As the velocity of the mature cysts was less than that of the cell clusters, we sought other factors to accelerate cyst rotation. After trying several drugs, we found that vorinostat, a pan histone deacetylase (HDAC) inhibitor, enhanced the velocity of cyst rotation, whereas K‐RASV12 seems to be required for the maintenance of the rotating cyst structure (Figure 5A and Movie S5). Similar results were observed with other HDAC inhibitors, trichostatin A, mocetinostat and scriptaid (data not shown), suggesting that the effect is mediated by class I HDAC. Quantification was carried out as in cell cluster rotation (Figure 5B,C). The mature cysts without K‐RASV12 rotated at 5.42 μm/h, and K‐RASV12 expression accelerated the velocity to 6.60 μm/h. Vorinostat treatment further enhanced the velocity to 10.3 μm/h, which is less than that of the cell cluster rotation by K‐RASV12 (26.8 μm/h, Figure 2D). As vorinostat inhibited cell growth (Figure 5A), we counted the numbers of cells in a cyst, and examined the velocity and cross‐product as shown in Figure 2. As shown in Figure 5D, vorinostat treatment suppressed the number of cells per cyst in the presence of K‐RASV12 (left graph, orange line vs magenta line). Treatment with vorinostat was effective for cross‐product and velocity, when the number of cells per cyst was more than 5 (middle and right graphs).
Figure 5.
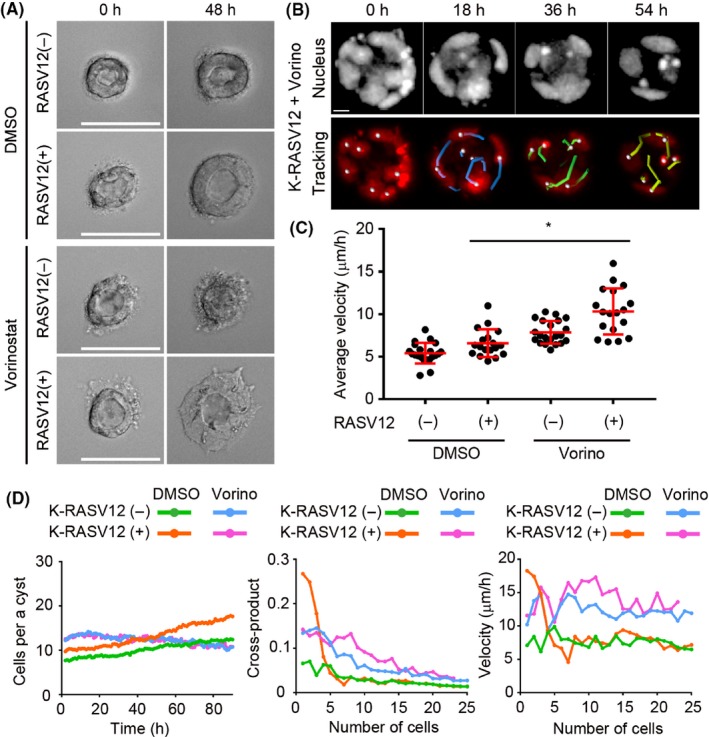
Acceleration by vorinostat of K‐RASV12‐induced rotation of mature cysts. A, Representative images of MDCK mature cysts treated with 0.1% DMSO (K‐RASV12(+)), 50 nmol/L naphthaleneacetic acid (NAA) (K‐RASV12(−)), vorinostat (Vorino; 2 μmol/L) or a combination of NAA and vorinostat for 24 h and 48 h from culture day 6. Scale bar = 50 μm. B, MDCK mature cyst treated with vorinostat was imaged with a confocal microscope (upper panels), and the nuclei were tracked with IMARIS software (lower panels). Scale bar = 10 μm. C, Nuclear velocities of the indicated cysts are shown as dot plots with the mean ± SD. Each dot represents the average nuclear velocity of a cyst, and similar results were obtained in 3 independent experiments. D, Cell numbers (right), cross‐product per cell (middle), and velocity by cell numbers were analyzed as in Figure 2E. Similar results were obtained in 3 independent experiments
3.6. Activation of β‐catenin pathways in the mature cyst with K‐RASV12 and vorinostat
To understand the molecular mechanism by which K‐RAS and vorinostat cooperatively induce rotation, we compared mRNA expression among mature MDCK cysts with or without K‐RASV12 and/or vorinostat (Figure 6A). Gene set enrichment analysis using the data on MDCK‐K‐RASV12 with vorinostat and DMSO suggested that several pathways were upregulated in vorinostat‐treated MDCK with K‐RASV12 cysts, that is, the EGFR‐RAS‐RAF‐MAPK, β‐catenin and Gli pathways30 (Figure 6B). It has been reported that the Hedgehog‐Gli pathway is located upstream of β‐catenin,31 therefore we further focused on β‐catenin. In 2D MDCK cells, vorinostat treatment induced expression of the β‐catenin, which localized to the plasma membrane, the nucleus and the cytoplasm (Figure 6C). By western blot analysis, we confirmed that vorinostat significantly upregulated β‐catenin expression in MDCK cells (Figure 6D,E) regardless of K‐RASV12 induction.
Figure 6.
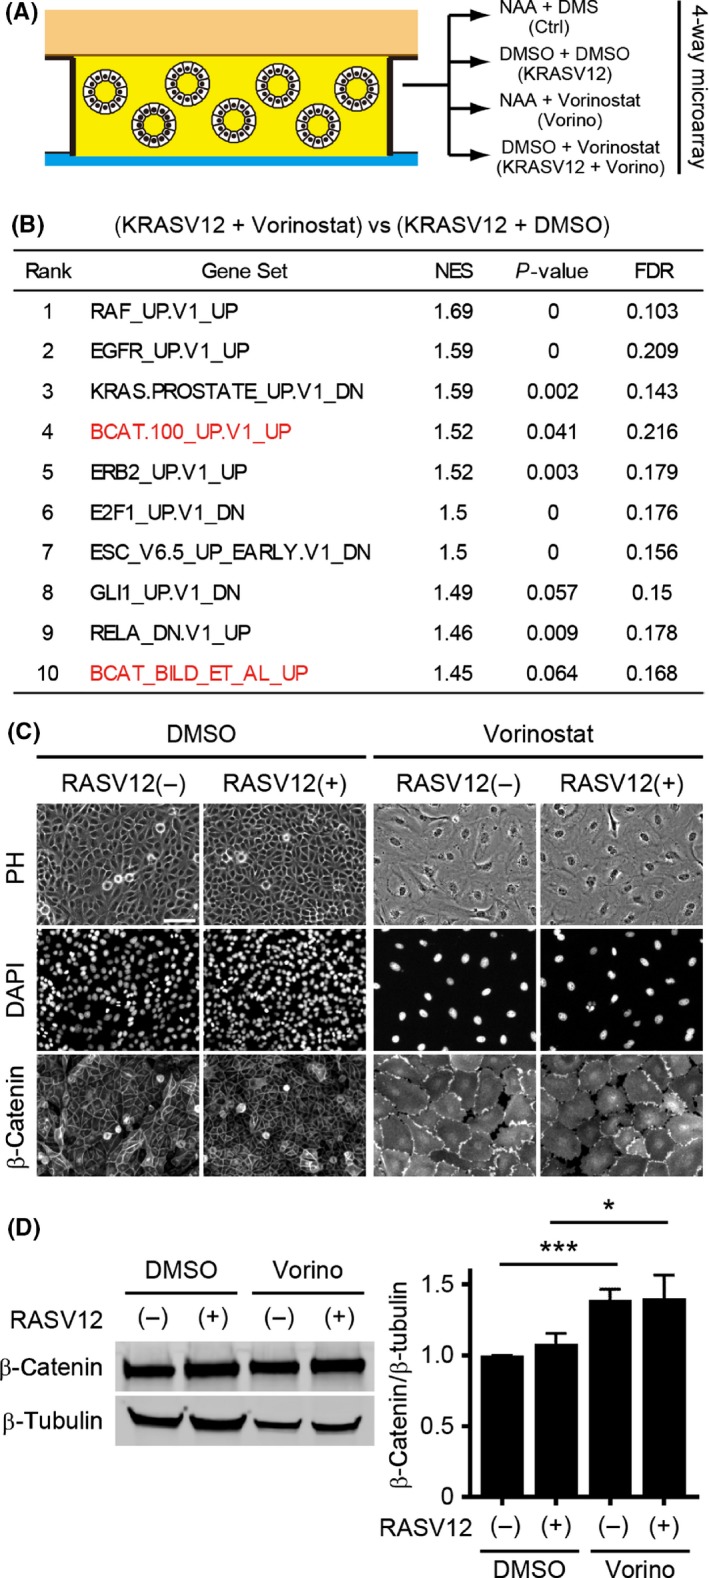
Upregulation of the β‐catenin pathway by vorinostat (Vorino) treatment. A, Schematic of microarray experiments with MDCK mature cysts. B, Top 10 gene sets (C2 curated) enriched in (KRASV12 + vorinostat) compared with (KRASV12 + DMSO) MDCK cysts. C, Representative immunostaining images of MDCK cells treated with 0.1% DMSO (K‐RASV12(+)), 50 nmol/L naphthaleneacetic acid (NAA) (K‐RASV12(−)), vorinostat (2 μmol/L) or a combination of NAA and vorinostat for 24 h. Scale bar = 100 μm. D,E, Representative immunoblot images of MDCK cells treated with 0.1% DMSO (K‐RASV12(+)), 50 nmol/L NAA (K‐RASV12(−)), vorinostat (2 μmol/L) or a combination of NAA and vorinostat for 24 h (D) and the relative intensities of β‐catenin/β‐tubulin from 3 independent experiments were quantified
3.7. β‐Catenin induced cyst rotation but not cell cluster rotation
It has been reported that the combined activation of both K‐RAS and Wnt/β‐catenin signaling leads to a dramatic increase in both tumor incidence and size in a lung cancer mouse model32 and that upregulation of the Wnt/β‐catenin signaling pathway leads to increased tumor metastasis from the primary tumors.33, 34 It is therefore possible that expression of β‐catenin together with K‐RASV12 altered the cell dynamics. The stable β‐catenin mutant BCAT, in which 4 serine/threonine residues were substituted to alanine, was expressed in MDCK cells, and its localization was observed in mature cysts. As shown in Figure 7A, BCAT is mainly distributed in the nucleus and cytoplasm. Much as in the case of vorinostat treatment (Figure 6C), BCAT expression induced larger cells (Figure 7A). Live imaging and quantification of mature cysts revealed that BCAT expression accelerated mature cyst rotation, whereas it seems that active K‐RAS is required for the maintenance of rotating cyst structure (Figure 7B,C and Movie S6). These data indicate that changes by vorinostat treatment and β‐catenin expression share common signaling pathways for mature cyst rotation.
Figure 7.
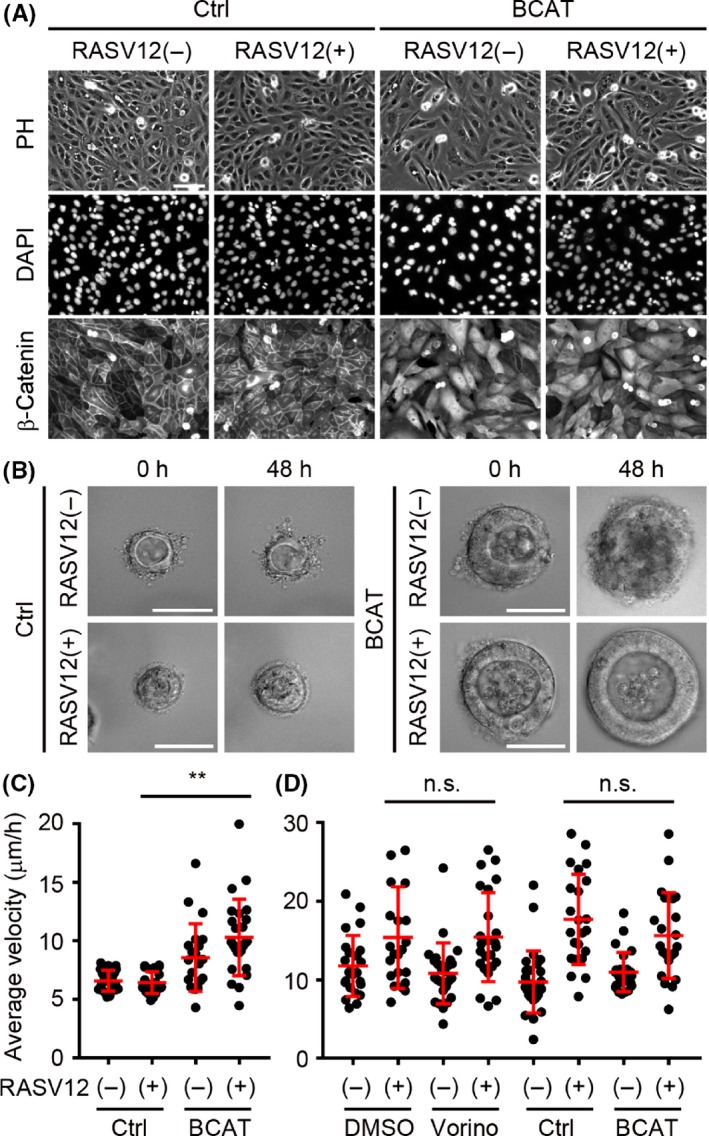
Metabolically stable β‐catenin accelerates K‐RASV12‐induced rotation of mature cysts. A, Representative immunostaining images of MDCK and MDCK‐BCAT cells treated with 0.1% DMSO (K‐RASV12(+)) or 50 nM naphthaleneacetic acid (NAA) (K‐RASV12(−)) for 24 h. Scale bar = 100 μm. B, Representative images of MDCK and MDCK‐BCAT mature cysts treated with 0.1% DMSO (K‐RASV12(+)) or 50 nmol/L NAA (K‐RASV12(−)) for 24 h and 48 h from culture day 6. Scale bar = 50 μm. C,D, Nuclear velocities of the indicated cysts (C) and cell clusters (D) are shown as dot plots with the mean ± SD. Each dot represents the average nuclear velocity of a cyst, and similar results were obtained in 3 independent experiments
Finally, to compare the requirement of these pathways between cell clusters and mature cysts, the effects of vorinostat and β‐catenin expression on cell cluster rotation were examined. As shown in Figure 7D, neither vorinostat nor β‐catenin accelerated cell cluster rotation, indicating that the mechanisms for cell cluster and mature rotation are different.
4. DISCUSSION
As an in vitro model of cancer cells at the invasive front, we here utilized MDCK cell clusters and cysts in the ECM (Figure 8) and developed a method for quantifying their rotation. By measuring the coherent motion (cross‐product) and velocity, we found for the first time that active K‐RAS induces cell cluster and cyst rotation (Figure 2), and the rotational velocity of cell clusters is faster than that of mature cysts (Figures 2 and 5), suggesting that they are regulated by distinct mechanisms (Figure 7D).
Figure 8.
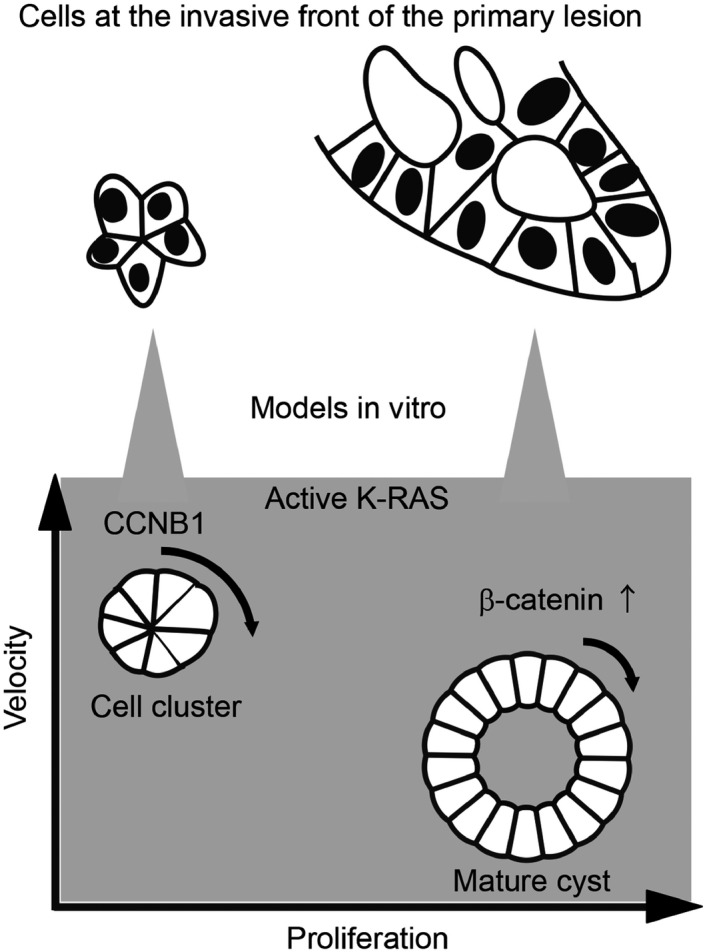
Summary of the in vitro model system for collective cell migration at the invasive front. CCNB1, cyclin B1
Cells restricted to collective invasion were capable of lymphatic invasion but not blood‐borne metastasis.35 Therefore, one potential application of our quantitative in vitro system to the field of cancer research would be for screening drugs to prevent lymphatic invasion in vitro. The limitation of our study is that the clusters/cysts themselves did not show persistent or random migration in the ECM, even though we could observe and quantify the motility of individual cells within the clusters/cysts. A plausible explanation is that chemokines secreted from the stroma, such as vessels, fibroblasts or macrophages, were absent in our in vitro system. As the collective cell migration of squamous cell carcinoma requires leading fibroblasts,36, 37 the epithelial cells derived from glands might also require fibroblasts for migration. Despite this limitation, we believe that changes in the cell‐intrinsic properties somehow contribute to the invasion process for the following reason. That is, a cell line derived from mouse colon cancer with active K‐RAS expression migrated as a cluster between the ECM gels (E. Kiyokawa, 2018, unpublished data). Advancements in in vivo long‐term imaging of the skin and intestine that permit monitoring for several days will be needed to determine the role of rotation in vivo.
Similar to colon cancers, the budding of pancreatic cancers could be related to metastasis.38 Small cell clusters in endometrial cancers, called MELF (microcystic, elongated and fragmented), have been associated with lymph node metastasis39, 40, 41, 42 and have been proposed as a risk factor for lymph node metastasis.43 Although our present study suggested that cell cluster rotation was an invasive model in vitro, it also suggested the possibility that the gland structure contributes to the invasion process in a different manner (Figures 5C and 7C). It is well known from daily diagnosis that metastatic pancreatic ductal carcinomas are well differentiated, and the most invasive components of some pancreatic cancers still form nearly perfect glands.44 The mature cyst dynamics in this study could be the key to explaining this observation. As cancer cells show heterogeneity, not only in the mutation states of the genes, but also the expression of nucleotides/proteins, such a difference in morphologies/dynamics is important to select drugs to prevent invasion/metastasis.
The molecular or cellular mechanisms induced by active K‐RAS remain uncertain. Previously, it was shown that MCF10A, a cell line derived from human mammary gland epithelial cells, rotates up to 4 days after embedding in ECM,29 and the rotation is blocked by Scrib or Pard3 knockdown. In our hands, however, knockdown of those genes in MDCK cells had no effect on the cell cluster rotation (data not shown), suggesting that cell cluster rotation is cell context‐dependent. Previously, the cancer‐derived cell lines did not show rotational motion.29 In another report, different cell lines derived from breast cancers were randomly motile and did not show coherent motion.29 As K‐RAS mutation is basically absent from breast cancers,10 the rotation induced by K‐RAS might be important in other cancers such as the pancreas, colon and lungs. As downstream factors of K‐RASV12 involved in cyst rotation, the RAF‐MAPK and PIK pathways are both required, and activation of the MEK and RALGEF pathways is sufficient for cell cluster rotation, but has less effect on the velocity of rotation (Figure 3). These results indicate that multiple signaling pathways are required for full cell cluster rotation.
The expression of stable β‐catenin induced cyst rotation (Figure 7), but not cell cluster rotation. As a possible explanation for this difference, we hypothesize that β‐catenin at the plasma membrane strengthens the cell‐cell adhesion in mature cysts, but not in cell clusters, for which cell‐cell adhesion has not been fully established. This idea is supported by the facts that endogenous β‐catenin was induced by vorinostat and exogenous β‐catenin was localized to the plasma membrane at the cell‐cell contact area (Figure 7). It is also supported by the previous observation that β‐catenin was localized to the cell‐cell adhesion area together with α‐catenin45 and that the epithelial cell sheet utilizes traction force for the cellular migration, where cell‐cell adhesion is required.46, 47 We have not determined whether or not transcriptional activity of β‐catenin/lymphoid enhancer binding factor (T‐cell factor) is important for cyst rotation, due to the low sensitivity of TOP‐GFP reporters in our hands (data not shown). In the clinical materials, heterogeneous β‐catenin localization has been reported; nuclear overexpression of β‐catenin was observed in less than half the cases of colon cancers,48 whereas Wnt/β‐catenin signaling is deregulated in more than 90% of all CRCs.49, 50 Even in β‐catenin‐positive patients, nuclear localization is heterogeneous in pathological sections48 (E. Kiyokawa, 2018, unpublished observation), indicating that β‐catenin in the nucleus and β‐catenin in the plasma membrane contribute to carcinogenesis and progression in distinct ways.
We also found that CCNB1 is required for cell cluster rotation (Figure 4). A previous meta‐analysis showed that the contribution of CCNB1 expression in solid tumors to prognosis is controversial.1, 51, 52 Western blot and mRNA expression analyses indicated that the elevated expression was negatively associated with lymph node metastasis, distant metastasis stage and TNM stage in CRC.53 Immunohistochemistry studies suggest, however, that CCNB1 expression in the cytoplasm of cancer cells is not a predictor of prognosis in patients with CRC.54 Although molecular biology studies indicate that CCNB1 functions to regulate the cell cycle in the nucleus,28 our preliminary experiment showed that GFP‐tagged CCNB1 is localized to the cytoplasm in MDCK cells (data not shown). It is therefore possible that CCNB1 has some functions to regulate the cytoplasmic events for cell invasion processes. It will be necessary to examine CCNB1 expression in the cell clusters in K‐RAS‐mutated tumors in order to certify our results.
CONFLICT OF INTEREST
The authors declare that there are no conflict of interests in regard to this study.
Supporting information
ACKNOWLEDGEMENTS
We thank Dr. Hisako Takigawa‐Imamura for her input. We are grateful to T. Kanitani, A. Kinebuchi, Y. Nakashima, A. Nakayama and K. Taniguchi for their technical assistance. This work was supported by a Japan Society for the Promotion of Science (JSPS) Kakenhi Grant (17K14997), a Grant‐in‐Aid for Scientific Research on Innovative Areas (26112719) and by funds from the Promotion and Mutual Aid Corporation for Private Schools of Japan (The Science Research Promotion Fund for Young Scientists, No. 23).
Hirata E, Ichikawa T, Horike S‐I, Kiyokawa E. Active K‐RAS induces the coherent rotation of epithelial cells: A model for collective cell invasion in vitro. Cancer Sci. 2018;109:4045–4055. 10.1111/cas.13816
Eishu Hirata and Takehiko Ichikawa contributed equally to this work.
REFERENCES
- 1. Cheung KJ, Ewald AJ. A collective route to metastasis: seeding by tumor cell clusters. Science. 2016;352:167. [DOI] [PMC free article] [PubMed] [Google Scholar]
- 2. Friedl P, Locker J, Sahai E, et al. Classifying collective cancer cell invasion. Nat Cell Biol. 2012;14:777‐783. [DOI] [PubMed] [Google Scholar]
- 3. Ueno H, Murphy J, Jass JR, et al. Tumour ‘budding’ as an index to estimate the potential of aggressiveness in rectal cancer. Histopathology. 2002;40:127‐132. [DOI] [PubMed] [Google Scholar]
- 4. Ueno H, Kajiwara YF, Shimazaki HF, et al. New criteria for histologic grading of colorectal cancer. Am J Surg Pathol. 2012;2012(36):193‐201. [DOI] [PubMed] [Google Scholar]
- 5. Rogers AC, Winter DC, Heeney A, et al. Systematic review and meta‐analysis of the impact of tumour budding in colorectal cancer. Br J Cancer. 2016;115:831‐840. [DOI] [PMC free article] [PubMed] [Google Scholar]
- 6. Ueno H, Mochizuki HF, Hashiguchi YF, et al. Histological grading of colorectal cancer: a simple and objective method. Ann Surg. 2008;247:811‐818. [DOI] [PubMed] [Google Scholar]
- 7. Ueno H, Hashiguchi Y, Kajiwara Y, et al. Proposed objective criteria for grade 3 in early invasive colorectal cancer. Am J Clin Pathol. 2010;134:312‐322. [DOI] [PubMed] [Google Scholar]
- 8. Kiyokawa E, Minato H. Activated K‐RAS and its effect on morphological appearance. J Biochem. 2014;156:137‐145. [DOI] [PubMed] [Google Scholar]
- 9. Bos JL. Ras oncogenes in human cancer: a Review. Cancer Res. 1989;49:4682. [PubMed] [Google Scholar]
- 10. Prall F, Ostwald C. High‐degree tumor budding and podia‐formation in sporadic colorectal carcinomas with K‐ras gene mutations. Hum Pathol. 2007;38:1696‐1702. [DOI] [PubMed] [Google Scholar]
- 11. Barresi V, Bonetti LR, Bettelli S. KRAS, NRAS, BRAF mutations and high counts of poorly differentiated clusters of neoplastic cells in colorectal cancer: observational analysis of 175 cases. Pathology. 2015;47:551‐556. [DOI] [PubMed] [Google Scholar]
- 12. Nishioka T, Aoki K, Hikake K, et al. Rapid turnover rate of phosphoinositides at the front of migrating MDCK cells. Mol Biol Cell. 2008;19:4213‐4223. [DOI] [PMC free article] [PubMed] [Google Scholar]
- 13. Mizuno R, Kamioka Y, Kabashima K, et al. In vivo imaging reveals PKA regulation of ERK activity during neutrophil recruitment to inflamed intestines. J Exp Med. 2014;211:1123‐1136. [DOI] [PMC free article] [PubMed] [Google Scholar]
- 14. Takeda H, Kiyokawa E. Activation of Erk in ileal epithelial cells engaged in ischemic‐injury repair. Sci Rep. 2017;7:16469. [DOI] [PMC free article] [PubMed] [Google Scholar]
- 15. Hirata E, Kiyokawa E. Future perspective of single‐molecule FRET biosensors and intravital FRET microscopy. Biophys J . 2016;111:1103‐1111. [DOI] [PMC free article] [PubMed] [Google Scholar]
- 16. O'Brien LE, Zegers MM, Mostov KE. Opinion: building epithelial architecture: insights from three‐dimensional culture models. Nat Rev Mol Cell Biol. 2002;3:531‐537. [DOI] [PubMed] [Google Scholar]
- 17. Yagi S, Matsuda M, Kiyokawa E. Suppression of Rac1 activity at the apical membrane of MDCK cells is essential for cyst structure maintenance. EMBO Rep. 2012;13:237. [DOI] [PMC free article] [PubMed] [Google Scholar]
- 18. Yagi S, Matsuda M, Kiyokawa E. Chimaerin suppresses Rac1 activation at the apical membrane to maintain the cyst structure. PLoS One. 2012;7:e52258. [DOI] [PMC free article] [PubMed] [Google Scholar]
- 19. Kumagai Y, Kamioka Y, Yagi S, et al. A genetically encoded Forster resonance energy transfer biosensor for two‐photon excitation microscopy. Anal Biochem. 2011;413:192‐199. [DOI] [PubMed] [Google Scholar]
- 20. Yoshizaki H, Kuwajima Y, Minato H, et al. Regulation of Ripply1 expression in MDCK organoids. Biochem Biophys Res Commun. 2015;468:337‐342. [DOI] [PubMed] [Google Scholar]
- 21. Yoshizaki H, Ogiso H, Okazaki T, et al. Comparative lipid analysis in the normal and cancerous organoids of MDCK cells. J Biochem. 2016;159:573‐584. [DOI] [PMC free article] [PubMed] [Google Scholar]
- 22. Mori Y, Yagi S, Sakurai A, et al. Insufficient ability of Rac1b to perturb cystogenesis. Small GTPases. 2013;4:9‐15. [DOI] [PMC free article] [PubMed] [Google Scholar]
- 23. Sakurai A, Matsuda M, Kiyokawa E. Activated Ras protein accelerates cell cycle progression to perturb Madin‐Darby Canine Kidney cystogenesis. J Biol Chem. 2012;287:31703‐31711. [DOI] [PMC free article] [PubMed] [Google Scholar]
- 24. Nishimura K, Fukagawa T, Takisawa H, et al. An auxin‐based degron system for the rapid depletion of proteins in nonplant cells. Nat Methods. 2009;6:917‐922. [DOI] [PubMed] [Google Scholar]
- 25. Rodriguez‐Viciana P, Warne PH, Khwaja A, et al. Role of phosphoinositide 3‐OH kinase in cell transformation and control of the actin cytoskeleton by Ras. Cell. 1997;89:457‐467. [DOI] [PubMed] [Google Scholar]
- 26. Nolen BJ, Tomasevic N, Russell A, et al. Characterization of two classes of small molecule inhibitors of Arp2/3 complex. Nature. 2009;460:1031. [DOI] [PMC free article] [PubMed] [Google Scholar]
- 27. Rizvi SA, Neidt EM, Cui J, et al. Identification and characterization of a small molecule inhibitor of Formin‐mediated actin assembly. Chem Biol. 2009;16:1158‐1168. [DOI] [PMC free article] [PubMed] [Google Scholar]
- 28. Sonawane YA, Taylor MA, Napoleon JV, et al. Cyclin Dependent Kinase 9 inhibitors for cancer therapy. J Med Chem. 2016;59:8667‐8684. [DOI] [PMC free article] [PubMed] [Google Scholar]
- 29. Wang H, Lacoche S, Huang L, et al. Rotational motion during three‐dimensional morphogenesis of mammary epithelial acini relates to laminin matrix assembly. Proc Natl Acad Sci USA. 2013;110:163‐168. [DOI] [PMC free article] [PubMed] [Google Scholar]
- 30. Hirata E, Girotti MR, Viros A, et al. Intravital imaging reveals how BRAF inhibition generates drug‐tolerant microenvironments with high Integrin β1/FAK Signaling. Can Cell. 2015;27:574‐588. [DOI] [PMC free article] [PubMed] [Google Scholar]
- 31. Pasca di Magliano M, Biankin AV, Heiser PW, et al. Common activation of canonical Wnt signaling in pancreatic adenocarcinoma. PLoS One. 2007;2:e1155. [DOI] [PMC free article] [PubMed] [Google Scholar]
- 32. Pacheco‐Pinedo EC, Durham AC, Stewart KM, et al. Wnt/β‐catenin signaling accelerates mouse lung tumorigenesis by imposing an embryonic distal progenitor phenotype on lung epithelium. J Clin Invest. 2011;121:1935‐1945. [DOI] [PMC free article] [PubMed] [Google Scholar]
- 33. Chen Y, Shi HY, Stock SR, et al. Regulation of breast cancer‐induced bone lesions by β‐Catenin protein signaling. J Biol Chem. 2011;286:42575‐42584. [DOI] [PMC free article] [PubMed] [Google Scholar]
- 34. Dey N, Barwick BG, Moreno CS, et al. Wnt signaling in triple negative breast cancer is associated with metastasis. BMC Cancer. 2013;13:537. [DOI] [PMC free article] [PubMed] [Google Scholar]
- 35. Giampieri S, Manning C, Hooper S, et al. Localized and reversible TGFβ signalling switches breast cancer cells from cohesive to single cell motility. Nat Cell Biol. 2009;11:1287‐1296. [DOI] [PMC free article] [PubMed] [Google Scholar]
- 36. Gaggioli C, Hooper S, Hidalgo‐Carcedo C, et al. Fibroblast‐led collective invasion of carcinoma cells with differing roles for RhoGTPases in leading and following cells. Nat Cell Biol. 2007;9:1392‐1400. [DOI] [PubMed] [Google Scholar]
- 37. Labernadie A, Kato T, Brugues A, et al. A mechanically active heterotypic E‐cadherin/N‐cadherin adhesion enables fibroblasts to drive cancer cell invasion. Nat Cell Biol. 2017;19:224‐237. [DOI] [PMC free article] [PubMed] [Google Scholar]
- 38. Karamitopoulou E, Zlobec I, Born D, et al. Tumour budding is a strong and independent prognostic factor in pancreatic cancer. Eur J Cancer. 2013;49:1032‐1039. [DOI] [PubMed] [Google Scholar]
- 39. Pelletier MP, Trinh VQ, Stephenson P, et al. Microcystic, elongated and fragmented (MELF) pattern invasion is mainly associated with isolated tumor cell pattern metastases in FIGO grade I endometrioid endometrial cancer (EEC). Hum Pathol. 2016;62:33‐39. [DOI] [PubMed] [Google Scholar]
- 40. Stewart CJR, Brennan BA, Leung YC, et al. MELF pattern invasion in endometrial carcinoma: association with low grade, myoinvasive endometrioid tumours, focal mucinous differentiation and vascular invasion. Pathology. 2009;41:454‐459. [DOI] [PubMed] [Google Scholar]
- 41. Joehlin‐Price AS, McHugh KE, Stephens J, et al. The Microcystic, Elongated, and Fragmented (MELF) pattern of invasion: a single institution report of 464 consecutive FIGO Grade 1 endometrial endometrioid adenocarcinomas. Am J Surg Pathol. 2016;41:49‐55. [DOI] [PMC free article] [PubMed] [Google Scholar]
- 42. Euscher E, Fox P, Bassett R, et al. The pattern of myometrial invasion as a predictor of lymph node metastasis or extrauterine disease in low‐grade endometrial carcinoma. Am J Surg Pathol. 2013;2013(37):1728‐1736. [DOI] [PMC free article] [PubMed] [Google Scholar]
- 43. Pavlakis K, Messini I, Vrekoussis T, et al. MELF invasion in endometrial cancer as a risk factor for lymph node metastasis. Histopathology. 2011;58:966‐973. [DOI] [PubMed] [Google Scholar]
- 44. McDonald OG, Maitra A, Hruban RH. Human correlates of provocative questions in pancreatic pathology. Adv Anat Pathol. 2012;19:351‐362. [DOI] [PMC free article] [PubMed] [Google Scholar]
- 45. Gallegos LL, Ng MR, Sowa ME, et al. A protein interaction map for cell‐cell adhesion regulators identifies DUSP23 as a novel phosphatase for β‐catenin. Sci Rep. 2016;6:27114. [DOI] [PMC free article] [PubMed] [Google Scholar]
- 46. Trepat X, Fredberg JJ. Plithotaxis and emergent dynamics in collective cellular migration. Trends Cell Biol. 2011;21:638‐646. [DOI] [PMC free article] [PubMed] [Google Scholar]
- 47. Das T, Safferling K, Rausch S, et al. A molecular mechanotransduction pathway regulates collective migration of epithelial cells. Nat Cell Biol. 2015;17:276‐287. [DOI] [PubMed] [Google Scholar]
- 48. Kobayashi M, Honma T, Matsuda Y, et al. Nuclear translocation of β‐catenin in colorectal cancer. Br J Can. 2000;82:1689. [DOI] [PMC free article] [PubMed] [Google Scholar]
- 49. The Cancer Genome Atlas Network . Comprehensive molecular characterization of human colon and rectal cancer. Nature. 2012;487:330. [DOI] [PMC free article] [PubMed] [Google Scholar]
- 50. Bruun J, Kolberg M, Nesland JM, et al. Prognostic Significance of β‐Catenin, E‐Cadherin, and SOX9 in colorectal cancer: results from a large population‐representative series. Front Oncol. 2014;4:118. [DOI] [PMC free article] [PubMed] [Google Scholar]
- 51. Wen Y, Cao L, Lian WP, et al. The prognostic significance of high/positive expression of cyclin B1 in patients with three common digestive cancers: a systematic review and meta‐analysis. Oncotarget. 2017;8:96373‐96383. [DOI] [PMC free article] [PubMed] [Google Scholar]
- 52. Ye C, Wang J, Wu P, et al. Prognostic role of cyclin B1 in solid tumors: a meta‐analysis. Oncotarget. 2017;8:2224‐2232. [DOI] [PMC free article] [PubMed] [Google Scholar]
- 53. Fang Y, Liang X, Jiang W, et al. Cyclin B1 suppresses colorectal cancer invasion and metastasis by regulating E‐Cadherin. PLoS One. 2015;10:e0126875. [DOI] [PMC free article] [PubMed] [Google Scholar]
- 54. Grabsch H, Lickvers K, Hansen OF, et al. Prognostic value of cyclin B1 protein expression in colorectal cancer. Am J Clin Pathol. 2004;122:511‐516. [DOI] [PubMed] [Google Scholar]
Associated Data
This section collects any data citations, data availability statements, or supplementary materials included in this article.
Supplementary Materials