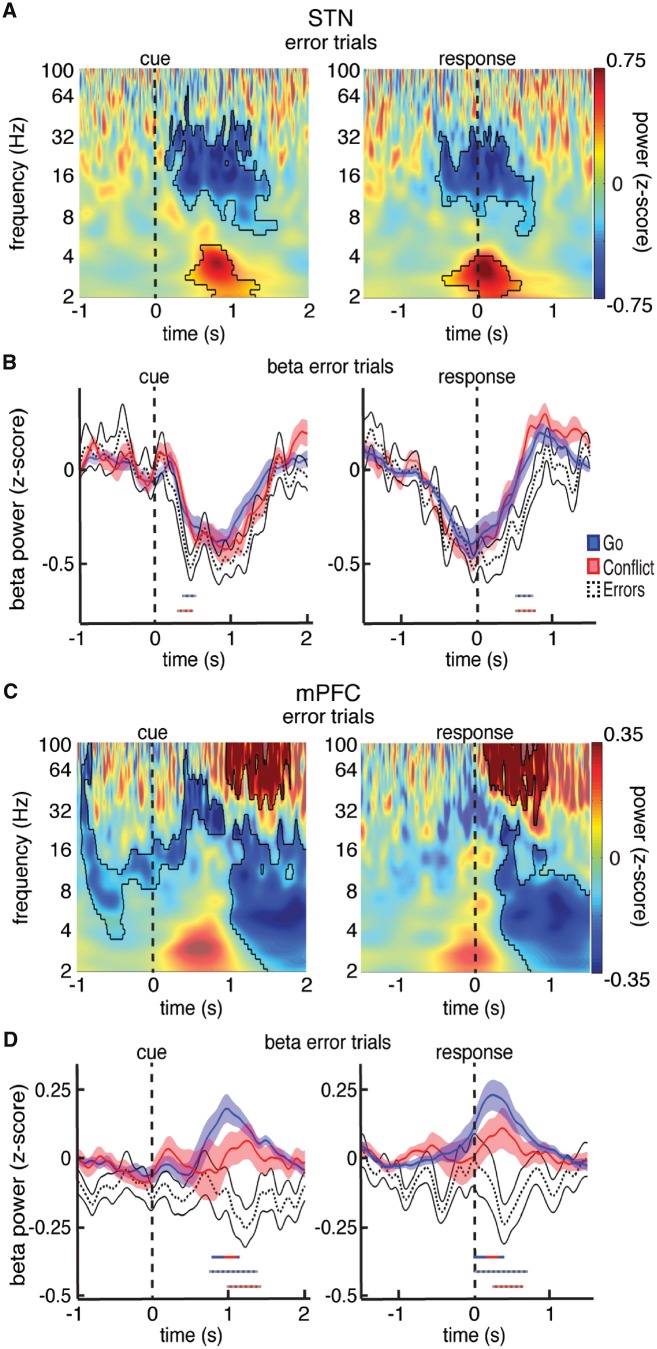
Figure 5.
Trial type related differences in beta power during errors. (A) Normalized oscillatory power averaged across all STN electrodes and across all incorrect trials. Mask indicates time-frequency regions exhibiting significant differences from baseline (P < 0.05, corrected for multiple comparisons, permutation test). (B) Same as in A but averaged across the entire beta band. The beta power time series are also shown for the Go and Conflict trials for comparison. Time points exhibiting a significant difference between trial types (P < 0.05, corrected for multiple comparisons, permutation test) are denoted by coloured horizontal bars denoting which comparison was made. (C and D) Same as in A and B but for the mPFC. Whereas the STN showed an early decrease in beta power that was more pronounced during error trials, the mPFC showed a post-response increase in beta power that was attenuated or even reversed during trials that involved either conflict or errors.

