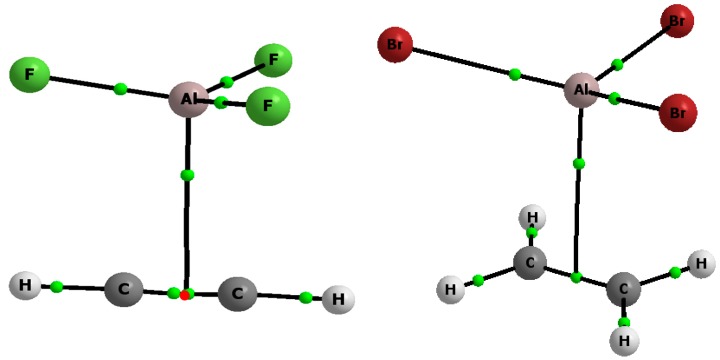
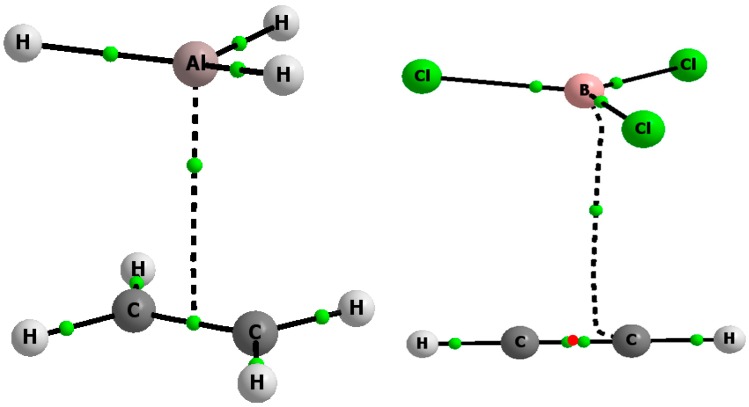
Figure 2.
The molecular graphs of the AlF3-C2H2 (the top left), AlBr3-C2H4 (the top right), AlH3-C2H4 (the bottom left) and BCl3-C2H2 (the bottom right) complexes, big circles correspond to attractors, small green circles to the bond critical points, small red circles to the nonnuclear attractors and the solid and broken lines to the bond paths.


