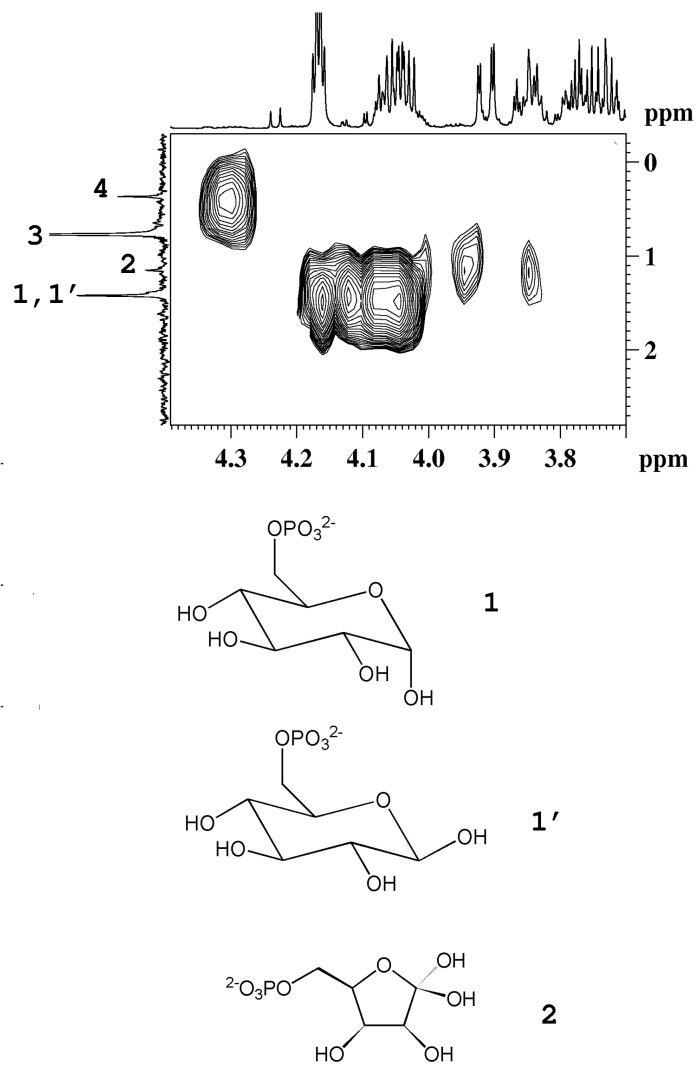
Figure 4.
1H-31P HMBC map of an aqueous extract of kiwifruit. The 1H and the 31P{1H}-decoupled NMR spectra are reported as projections in the F2 and F1 dimensions, respectively. 1, 1', α-glucose-6-phosphate and β-glucose-6-phosphate; 2, fructose-6-phosphate; 3, orthophosphate; 4, unassigned compound (adapted from [6]).

