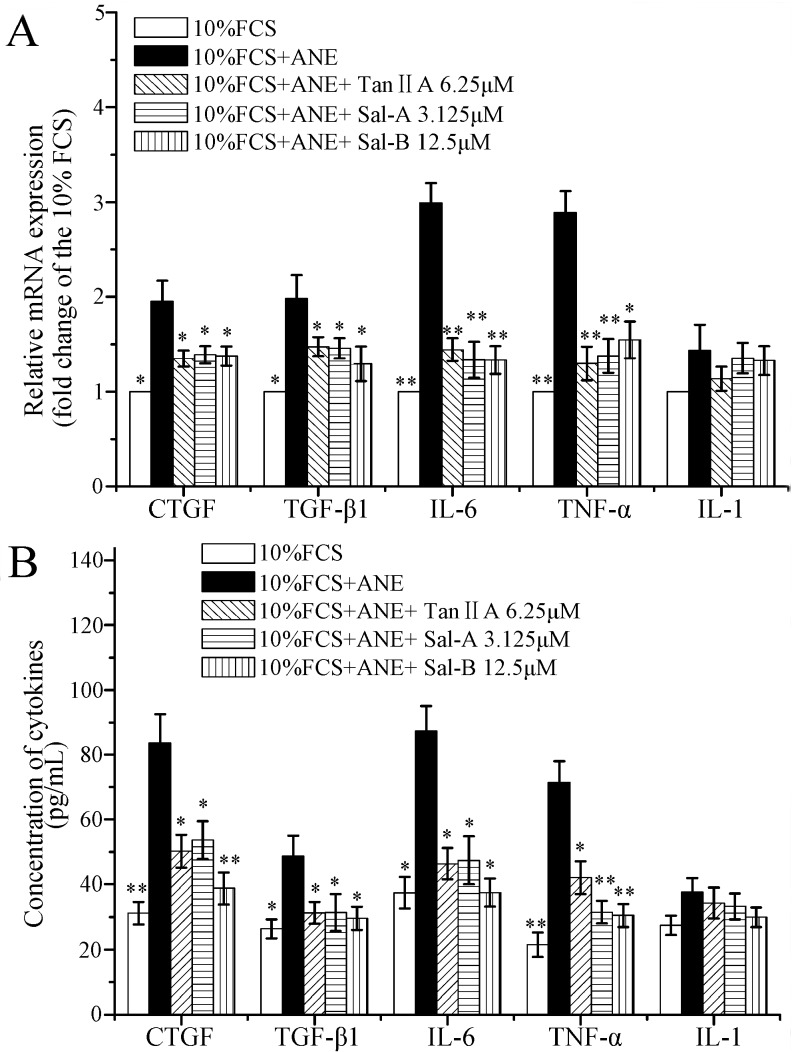
Figure 5.
Influence of Tan-IIA1, Sal-A and Sal-B on the transcription and release of cytokines after ANE treatment. MOMFs were exposed to ANE (12.5 μg/mL), with or without Tan-IIA1 (6.25 μM), Sal-A (3.125 μM) and Sal-B (12.5 μM) for 48 h. The cells were harvested and used in qRT-PCR assay (A); and the supernatants were collected and used in ELISA assay (B). n = 5, * p < 0.05 and ** p < 0.01 vs. the FCS + ANE group.

