

Abstract
We studied a cohort of 15,620 adults who had experienced at least 1 jail incarceration and 1 homeless shelter stay in 2001–2003 in New York City to identify trajectories of these events and tested whether a particular trajectory was associated with all-cause, drug-related, or human immunodeficiency virus (HIV)–related mortality risk in 2004–2005. Using matched data on jail time, homeless shelter stays, and vital statistics, we performed sequence analysis and assessed mortality risk using standardized mortality ratios (SMRs) and marginal structural modeling. We identified 6 trajectories. Sixty percent of the cohort members had a temporary pattern, which was characterized by sporadic experiences of brief incarceration and homelessness, whereas the rest had the other 5 patterns, which reflected experiences of increasing, decreasing, or persistent jail or shelter stays. Mortality risk among individuals with a temporary pattern was significantly higher than those of adults who had not been incarcerated or stayed in a homeless shelter during the study period (all-cause SMR: 1.35, 95% confidence interval (CI): 1.14, 1.59; drug-related SMR: 4.60, 95% CI: 3.17, 6.46; HIV-related SMR: 1.54, 95% CI: 1.03, 2.21); all-cause and HIV-related SMRs in other patterns were not statistically significantly different. When we compared all 6 trajectories, the temporary pattern was more strongly associated with higher mortality risk than was the continuously homelessness pattern. Institutional interventions to reduce recurrent cycles of incarceration and homelessness are needed to augment behavioral interventions to reduce mortality risk.
Keywords: death, homeless persons, institutionalization, New York City, urban population
Frequent transitions into and out of institutions, such as hospitals, jails, and homeless shelters (known as the revolving-door pattern), have been linked with adverse health conditions (1, 2). Researchers have postulated that the process of such institutionalizations, in particular repeated brief exposures to incarceration and homelessness, might directly cause damage to biological systems through stress-mediated pathways or indirectly affect health by disrupting stable access to health-promoting resources (3–5). Few studies have provided evidence that mortality and morbidity risks are temporally associated with experiences of incarceration or homelessness (2, 6). For example, former inmates from New York City had a higher risk of dying in the period immediately after release than they did at a later time (2).
Prior risk profiles or static measures of incarceration/homelessness experiences, which are often examined as possible causal risk factors for poor health outcomes, might not account for these time-varying associations (7, 8). Most studies do not capture transitions into and out of jails or shelters over time. In part, this might reflect the challenges of quantifying the complexity and heterogeneity of these trajectories. However, recent progress has been made in a methodology known as group-based trajectory modeling, which can be used to capture concepts of sequence, duration, and timing to explain social phenomena, such as employment and criminal behaviors (9). Studies in which transitions to and from incarceration and homelessness are measured and their influences on mortality are examined are therefore needed. The purpose of the present study was to identify distinct trajectories of jail incarceration and homelessness using group-based trajectory modeling and to test whether particular trajectories were associated with mortality risk among adults from New York City. In addition to all-cause deaths, we studied drug-related and human immunodeficiency virus (HIV)–related deaths as outcomes, because studies have documented that risk of death from these causes is associated with time-specific incarceration and homelessness variables (e.g., immediate period after jail release, disrupted care due to cycling between institutions) (2, 10–12).
METHODS
Data sources and study population
In the present study, we used matched administrative data from the New York City Departments of Health and Mental Hygiene, Correction, and Homeless Services. We matched adults who had been incarcerated in New York City jails at some point from 2001 to 2005 with those in the New York City single adult shelter and vital statistics registries during the same time period. This probabilistic matching process has been validated, and the results have been previously published (2). We divided the data into 2 time frames. The first (2001–2003) was used to characterize incarceration/homelessness trajectories, and the second (2004–2005) was used to examine associations between trajectories and mortality in 2 years of follow-up. The study population included 15,620 subjects who experienced both jail incarceration and homelessness during 2001–2003 and survived through December 31, 2003. A comparison group included 5,830,224 adults from New York City who had not been incarcerated or stayed in a homeless shelter during the study period (hereafter referred to as nonsheltered and nonincarcerated). Because individual-level data for the comparison group were not available, we used aggregated death counts stratified by age, sex, race/ethnicity, and neighborhood poverty level from the New York City vital statistics registry and corresponding population counts from the United States Census 2000 data. The New York City Department of Health and Mental Hygiene Institutional Review Board determined that this study was not subject to institutional board review because it did not include research on human subjects.
Study variables
Outcome variables included all-cause deaths, deaths due to drug-related causes (codes F11–F16, F18–F19, X40–X42, and X44), and deaths due to HIV (codes B20–B24) (13). The exposure variable was trajectory of jail incarceration/homelessness, which was derived from group-based trajectory modeling using admission and discharge information from both New York City jail and single adult shelter registries in 2001–2003. Covariates included age on June 30, 2002, sex, race/ethnicity, nativity, neighborhood poverty level, a proxy for substance use (based on whether the subject was charged with drug possession or discharged to a substance use treatment clinic from the shelters), a proxy for serious mental illness (based on whether the subject was released to a state psychiatric hospital from jail or sent to a psychiatric emergency department/permanent supportive housing for mentally ill clients from shelters), and types of criminal charges (drug sales, violent crimes, weapon possession, public administration, property crimes, quality-of-life crimes, and sex crimes). We developed a directed acyclic graph to guide the determination of whether these variables were confounders or colliders (14) (Supplementary Data, available at http://aje.oxfordjournals.org/). We determined all covariates to be confounders of the trajectory-mortality association. Study participation (i.e., censoring) was identified as a collider because one would need to be found in both registries to have a particular trajectory assigned and would need to have survived through the end of 2003.
To account for differing times at risk, we calculated and used person-years as the denominator when calculating mortality rates. For subjects who died in 2004–2005, person-years were calculated as the time between January 1, 2004, and the date of death. Two full person-years were assigned to subjects who were alive as of December 31, 2005. For the comparison group, we estimated person-years by subtracting the total person-years of the incarcerated/homeless study population from proxy person-years of adults from New York City in 2004–2005 (2 × New York City adult population counts from United States Census 2000).
Statistical analysis
Sequence analysis
To determine exposure trajectories, we divided jail incarceration and shelter use records into time periods of 30 days, or “windows.” One of 3 events (incarceration, homelessness, or living in the community) was identified in each window, which yielded a sequence of 36 events during the 3-year period for each person. Specifically, if a jail incarceration event occurred during a particular window, that month was marked as incarceration. The same logic applied to homelessness events. If no incarceration or homelessness occurred, that month was marked as community dwelling, which reflected the fact that three-quarters of subjects were discharged to the community (rather than another institution) after incarceration. If both incarceration and homelessness occurred within a month, we counted the number of days spent in jail and in a shelter, and the event with higher numbers of days was assigned. If an equal number of days was spent in both jails and shelters, the event less prevalent in individual-level sequence was assigned. We then assessed and summarized the degree of dissimilarity in sequences using the Levenshtein distance (15) and performed a hierarchical cluster analysis using the Ward method, which resulted in nonoverlapping clusters that represented trajectories of jail incarceration and homelessness.
Standardized mortality ratio
We compared mortality rates for each trajectory with rates among nonincarcerated/nonsheltered adults from New York City using a standardized mortality ratio, which is the ratio of the observed to the expected number of deaths. In each trajectory, the observed numbers of deaths were counted, and expected numbers of deaths was estimated by multiplying the mortality rates of nonincarcerated/nonsheltered New York City residents by the person-years from the corresponding age, sex, race/ethnicity, and neighborhood poverty strata. We used the Poisson method to compute 2-sided 95% confidence intervals.
Marginal structural modeling
To determine whether particular trajectories were causally associated with mortality rates, we tested 3 causal assumptions (16). We first performed multinomial regression analysis using group-based trajectories of incarceration/homelessness as the dependent variable and baseline covariates that were identified as confounders as the independent variables. We then obtained a person's probability of appearing in each trajectory. An inverse of this probability was used as inverse probability of treatment weight (IPTW). To minimize influences from large weights, we stabilized the IPTW by replacing 1 in the numerator with a marginal probability of the observed trajectory (16). Weighted data met the assumptions for exchangeability (balanced baseline characteristics across trajectories; Supplementary Data), positivity (tightly distributed IPTW with 1 as a mean value; Supplementary Data), and stable unit treatment value (after adjustment for neighborhood poverty to address potential data dependency among some individuals) (17).
We then used a marginal structural Cox proportional hazard model to estimate the relationship between trajectories and mortality. Using IPTW to create a pseudopopulation for which causal assumptions hold, this model yields the marginal probability of the counterfactual random variables of mortality predicted by the trajectory groups (16). A sandwich estimator for variance and a corresponding P value were calculated because this estimator was robust against model misspecification. To reduce potential bias from tied events (18, 19), we used Efron's approximation method (20).
Missing data and imputation
To reduce potential bias resulting from excluding persons with missing data from the analysis (sex, 1%; race/ethnicity, 1%; nativity, 1%; neighborhood poverty level, 25%), we performed multiple imputations using IVEware (21). Because of the limited number of covariates and the relatively large amounts of missing data in the neighborhood poverty variable, we tested whether imputation was a reasonable approach for estimating missing data by assessing the agreement between actual and imputed neighborhood poverty data for a randomly selected 25% sample from the complete data. The estimated κ statistic was greater than the threshold (0.76 > 0.75), thus justifying imputation (22). We used multiple imputations to generate 5 imputed data sets, and we reported the combined results of the 5 estimates according to Schafer's approach, which accounts for within- and between-imputation variability (23).
Sensitivity analyses
Estimates from marginal structural modeling were potentially biased because of unobserved confounding, such as injectable drug use and chronic diseases. To address this issue, we quantified potential bias due to unobserved confounding by performing sensitivity analyses based on the bias equation of Vanderweele and Arah (24).
Additionally, prior exposure to jail incarceration/homelessness might lead to a biased association between a particular trajectory and mortality if the exposure periods were different from those in prior years. To address this issue, we repeated all the analyses for adults 25 years of age or younger because they were less likely to have prior incarceration/homelessness experiences than were older adults, which would ensure a more accurate trajectory. Because excluding subjects who died during 2001–2003 might introduce censoring bias, we also examined characteristics of adults who were excluded because of early deaths and repeated marginal structural modeling using the study cohort data that included these adults.
We used R, version 2.15 (R Foundation for Statistical Computing, Vienna, Austria) to perform sequence (TraMineR package) and cluster (cluster package) analyses. All the other analyses were performed using SAS, version 9.2 (SAS Institute, Inc., Cary, North Carolina). We determined the optimal number of trajectory groups according to the ratio of mean within-group distances to mean between-group distances <0.5 and relative improvement of this ratio due to adding one more group to the cluster solution (9). Statistical significance was established if the 2-sided P value was <0.05.
RESULTS
Using sequence analysis, we identified 6 nonoverlapping groups of jail incarceration and homelessness trajectories over 3 years among adults who had been both incarcerated and homeless: temporary (61% of cohort), transition to homelessness (11%), transition to incarceration (9%), transition from incarceration (8%), transition from homelessness (7%), and continuously homeless (4%) patterns (Figure 1). Persons with the temporary pattern sporadically experienced brief incarcerations and shelter stays. In contrast, those with the continuously homeless pattern spent extensive amounts of time in shelters (median, 662 days) without much interruption. Two other groups included adults who increasingly used homeless shelters during later months of the study period after community stays with sporadic incarceration (transition to homelessness) and those who experienced homelessness during early months followed by community stays with sporadic incarceration (transition from homelessness). Similarly, there were 2 groups for adults with sporadic homelessness: those for whom sporadic homelessness was followed by incarceration during later months (transition to incarceration) and those with incarceration during early months and sporadic homelessness afterward (transition from incarceration). Each baseline demographic characteristic and neighborhood poverty level were significantly associated with trajectory groups according to χ2 tests. However, in terms of the magnitude of the differences, these characteristics were similar across all trajectory groups except for continuously homeless subjects, who were much older than the others (Table 1).
Figure 1.
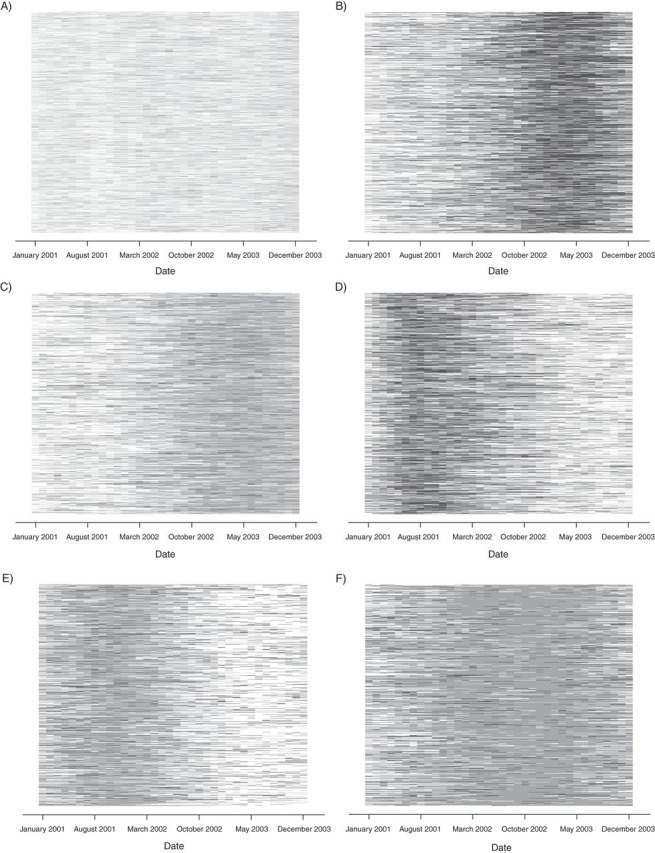
Six nonoverlapping groups of jail incarceration/homelessness trajectories according to sequence analysis among 15,620 adults who spent at least 1 night in a New York City jail and at least 1 night at a New York City single adult homeless shelter during 2001–2003. A) Temporary pattern (61%); B) transition to incarceration pattern (9%); C) transition to homelessness pattern (11%); D) transition from incarceration pattern (8%); E) transition from homelessness pattern (7%); F) continuously homeless pattern (4%). White, time living in the community; dark gray, incarceration; light gray, homelessness.
Table 1.
Demographic and Criminal Characteristics by 6 Trajectory Groups Among 15,620 Adults Who Were Incarcerated in a New York City Jail and Spent at Least 1 Night at a New York City Single Adult Homeless Shelter During 2001–2003
| Characteristic | Total (n = 15,620) |
Trajectory |
||||||||||||
|---|---|---|---|---|---|---|---|---|---|---|---|---|---|---|
| Temporary (n = 9,467) |
Transition to Incarceration (n = 1,343) |
Transition to Homelessness (n = 1,793) |
Transition From Incarceration (n = 1,293) |
Transition From Homelessness (n = 1,033) |
Continuously Homeless (n = 691) |
|||||||||
| No. | % | No. | % | No. | % | No. | % | No. | % | No. | % | No. | % | |
| Exposure in 2001–2003 | ||||||||||||||
| Median no. incarceration events | 2 | 1 | 4 | 2 | 3 | 1 | 2 | |||||||
| Median no. days in jail | 54 | 34 | 301 | 39 | 259 | 26 | 22 | |||||||
| Median no. of days in jail days incarceration | 25 | 19 | 82 | 19 | 83 | 12 | 11 | |||||||
| Median no. of shelter stays | 4 | 3 | 4 | 11 | 3 | 11 | 21 | |||||||
| Median no. of days in shelters | 42 | 20 | 32 | 273 | 20 | 314 | 662 | |||||||
| Median shelter days per shelter event | 8 | 6 | 6 | 25 | 6 | 29 | 33 | |||||||
| Age as of June 30, 2002, years | ||||||||||||||
| 18–24 | 11 | 12 | 10 | 9 | 10 | 8 | 5 | |||||||
| 25–34 | 25 | 26 | 27 | 21 | 25 | 21 | 15 | |||||||
| 35–44 | 41 | 40 | 45 | 40 | 46 | 41 | 39 | |||||||
| 45–54 | 19 | 18 | 15 | 24 | 15 | 25 | 32 | |||||||
| 55–89 | 5 | 4 | 3 | 6 | 4 | 5 | 9 | |||||||
| Sexa | ||||||||||||||
| Male | 90 | 90 | 92 | 90 | 91 | 90 | 89 | |||||||
| Female | 10 | 10 | 8 | 10 | 9 | 10 | 11 | |||||||
| Race/ethnicitya | ||||||||||||||
| Non-Hispanic white | 7 | 8 | 6 | 6 | 5 | 7 | 6 | |||||||
| Non-Hispanic black | 62 | 60 | 65 | 64 | 64 | 66 | 69 | |||||||
| Hispanic | 30 | 31 | 28 | 29 | 30 | 26 | 24 | |||||||
| Asian | 0 | 0 | 0 | 0 | 0 | 0 | 0 | |||||||
| Other/unknown | 1 | 1 | 1 | 1 | 1 | 1 | 1 | |||||||
| Nativitya | ||||||||||||||
| United States born | 90 | 89 | 91 | 88 | 94 | 88 | 88 | |||||||
| Foreign born | 10 | 11 | 9 | 12 | 6 | 12 | 12 | |||||||
| Neighborhood poverty levelb | ||||||||||||||
| Low (<10) | 2 | 2 | 2 | 3 | 2 | 3 | 4 | |||||||
| Medium (10 to <20) | 16 | 16 | 16 | 15 | 16 | 13 | 15 | |||||||
| High (20 to <30) | 10 | 10 | 9 | 10 | 9 | 9 | 8 | |||||||
| Very high (≥30) | 40 | 40 | 41 | 40 | 39 | 40 | 35 | |||||||
| Missing | 33 | 32 | 32 | 32 | 33 | 35 | 38 | |||||||
| Type of criminal charges | ||||||||||||||
| Drug possession | 37 | 34 | 51 | 35 | 46 | 35 | 43 | |||||||
| Drug sales | 21 | 18 | 31 | 19 | 35 | 14 | 22 | |||||||
| Violence | 32 | 30 | 46 | 33 | 40 | 30 | 28 | |||||||
| Public administration | 31 | 30 | 40 | 31 | 36 | 30 | 29 | |||||||
| Property | 41 | 37 | 60 | 39 | 53 | 40 | 44 | |||||||
| Weapons | 4 | 4 | 7 | 5 | 5 | 3 | 3 | |||||||
| Quality of life | 9 | 9 | 9 | 9 | 7 | 9 | 9 | |||||||
| Sex crimes | 3 | 2 | 3 | 3 | 4 | 3 | 4 | |||||||
| Substance usec | 41 | 37 | 54 | 42 | 49 | 39 | 51 | |||||||
| Serious mental illnessc | 3 | 2 | 4 | 6 | 2 | 6 | 9 | |||||||
a Because we did not include a small number of subjects among adults with incarceration who had missing data (sex, 1%; race/ethnicity, 1%; nativity, 1%), the sum of these numbers does not match the total numbers of individuals.
b Parenthetical values are the percentages of the neighborhood population who live below the poverty line.
c Proxy measures (in which substance use was defined as being charged with drug possession or transferred to a substance use treatment clinic and serious mental illness was defined as being transferred to a state psychiatric hospital or mental health treatment clinics) were used to capture substance use and prior severe mental illness.
During 2004–2005, the age-adjusted all-cause mortality rate among the study cohort was 1,086 per 100,000 person-years (95% confidence interval (CI): 911, 1,288), which was 33% higher than nonincarcerated/nonsheltered adults from New York City (816 per 100,000 person-years; 95% CI: 811, 821). After adjustment for age, the top 4 causes of death among the study cohort were cancer, heart disease, HIV, and drug-related causes, while those for nonincarcerated/nonsheltered adults from New York City were heart disease, cancer, other, and influenza and pneumonia (data not shown).
Comparisons with nonincarcerated/nonsheltered NYC adults
Compared with nonincarcerated/nonsheltered adults from New York City of the same age, sex, race/ethnicity, and neighborhood poverty level, adults in our study with a temporary pattern had a 1.35 times higher risk of death from all causes (95% CI: 1.14, 1.59), a 4.60 times higher risk of drug-related death (95% CI: 3.17, 6.46), and 1.54 times higher risk of HIV-related death (95% CI: 1.03, 2.21). All-cause and HIV-related mortality risks in subjects with all other patterns were not statistically different from those of nonincarcerated/nonsheltered New York City residents. We found a higher risk of drug-related death among subjects in all trajectory groups except for the transition to incarceration and continuously homeless patterns (Table 2).
Table 2.
Observed Number of Deaths and Standardized Mortality Ratios by Incarceration/Homelessness Trajectory Group Among 15,620 Adults Who Had Been Both Incarcerated and Homeless, New York City, 2004–2005
| Trajectory | All-Cause Death |
Drug-Related Death |
HIV-Related Death |
||||||
|---|---|---|---|---|---|---|---|---|---|
| No. of Deaths | SMRa | 95% CI | No. of Deaths | SMRa | 95% CI | No. of Deaths | SMRa | 95% CI | |
| Temporary | 144 | 1.35 | 1.14, 1.59 | 33 | 4.60 | 3.17, 6.46 | 29 | 1.54 | 1.03, 2.21 |
| Transition to incarceration | 12 | 0.80 | 0.41, 1.40 | 2 | 1.95 | 0.24, 7.04 | 3 | 1.06 | 0.22, 3.10 |
| Transition from incarceration | 18 | 1.23 | 0.73, 1.94 | 4 | 4.00 | 1.09, 10.25 | 4 | 1.46 | 0.40, 3.74 |
| Transition to homelessness | 20 | 0.81 | 0.49, 1.25 | 6 | 3.62 | 1.33, 7.87 | 2 | 0.46 | 0.06, 1.66 |
| Transition from homelessness | 18 | 1.24 | 0.73, 1.96 | 5 | 5.10 | 1.66, 11.91 | 2 | 0.77 | 0.09, 2.79 |
| Continuously homeless | 11 | 0.93 | 0.47, 1.67 | 1 | 1.29 | 0.03, 7.20 | 0 | N/A | N/A |
Abbreviations: CI, confidence interval; HIV, human immunodeficiency virus; N/A, not applicable; SMR, standardized mortality ratio.
a SMR among trajectory groups was compared with nonincarcerated/nonsheltered New York City residents and adjusted for for age, sex, race/ethnicity, and neighborhood poverty level.
Comparisons among the 6 incarceration/homelessness trajectory groups
After adjustment for differences in baseline covariates across the 6 trajectory groups, the risk of all-cause mortality among adults with the temporary pattern was 1.91 times higher (95% CI: 1.00, 3.68) than that of adults with the continuously homeless pattern during the 2-year follow-up period (Table 3). This pattern was also associated with a higher risk of drug-related death. Other patterns were not significantly different from the continuously homeless pattern, except that subjects with the transition from incarceration and transition to homelessness patterns had a higher risk of drug-related death. To address unreliable estimation due to small numbers of drug-related deaths, we examined the risk of all-cause mortality by trajectory group after excluding drug-related cases. The excess risk associated with the temporary versus the continuously homeless pattern was no longer observed, which provided further evidence for excess drug-related mortality risk in the temporary pattern (data not shown). Because there were 0 HIV-related deaths in the continuously homeless pattern, we collapsed 3 homelessness patterns and 2 incarceration patterns into 2 separate groups, and we consistently found excess mortality risk associated with the temporary pattern only.
Table 3.
Relative Risk From Marginal Structural Cox Proportional Hazard Regressiona for All-Cause, Drug-Related, and HIV-Related Mortality Rates by Incarceration/Homelessness Trajectory Groups Among 15,620 Adults Who Had Been Both Incarcerated and Homeless, New York City, 2004–2005
| Trajectory | All-Cause Death |
Drug-Related Death |
HIV-Related Deathb |
|||
|---|---|---|---|---|---|---|
| RR | 95% CI | RR | 95% CIc | RR | 95% CI | |
| Temporary | 1.91 | 1.00, 3.68 | 7.80 | 1.07, 56.86 | 3.32 | 1.14, 9.67 |
| Transition to incarceration | 1.21 | 0.49, 2.98 | 3.52 | 0.32, 38.75 | 3.41 | 0.95, 12.28 |
| Transition from incarceration | 1.99 | 0.88, 4.53 | 9.86 | 1.00, 97.30 | ||
| Transition to homelessness | 1.27 | 0.58, 2.78 | 7.58 | 0.90, 63.60 | 1.00 | Referent |
| Transition from homelessness | 1.88 | 0.86, 4.14 | 8.90 | 1.04, 76.22 | ||
| Continuously homeless | 1.00 | Referent | 1.00 | Referent | ||
Abbreviations: CI, confidence interval; HIV, human immunodeficiency virus; RR, relative risk.
a We used inverse probability of treatment weight to control for bias due to confounding. Potential confounders included age, sex, race/ethnicity, nativity, neighborhood poverty level, a proxy measure of substance use, a proxy measure of mental illness, and criminal charges for drug sales, violent crimes, weapon possession, public administration, property crimes, quality-of-life crimes, and sex crimes.
b Because there were 0 deaths attributed to HIV in the continuously homeless pattern, 3 trajectories of homelessness (transition to homelessness, transition from homelessness, and continuously homeless) and 2 trajectories of incarceration (transition to incarceration and transition from incarceration) were collapsed into homelessness and incarceration groups, respectively.
c Wide confidence intervals reflect a small number of outcome cases.
Sensitivity analyses
A sensitivity analysis for unobserved confounding revealed that if the prevalence of risk behaviors among subjects with the continuously homeless pattern was greater than that among subjects with the temporary pattern, which would be consistent with findings of observed risk factors in the present study, an unbiased estimate of the lower bound of the 95% confidence interval would have moved away from 1 (Supplementary Data). In a subset analysis of adults 25 years of age or younger that we performed to assess bias due to prior exposure, the temporary pattern was also associated with a higher mortality risk relative to the continuously homeless pattern, although this association was not statistically significant because of the small number of deaths (n = 15). The 146 individuals who died in 2001–2003 were older than those who lived (on average 46 versus 36 years old), but there were no systematic differences in other baseline characteristics and leading causes of death between both groups. We conducted repeated analyses that included person who had sufficient observation time to allow identification of trajectory groups (n = 84), and the excess all-cause and HIV-related mortality risk associated with temporary pattern was consistently observed (data not shown). However, the association between trajectory groups and risk of drug-related death was attenuated and no longer statistically significant, although drug-related mortality risk was still highest among subjects with the temporary pattern.
DISCUSSION
In the present retrospective cohort study of adults from New York City who had been both incarcerated and homeless, sporadic exposure to brief jail incarceration and homelessness (temporary pattern) was associated with excess risk of all-cause, drug-related, and HIV-related mortality during a 2-year follow-up period. In particular, adults from New York City with the temporary pattern were 35% more likely to die of any cause than were nonincarcerated/nonsheltered New York City residents of the same age, sex, race/ethnicity, and neighborhood poverty level. An excess risk of drug-related deaths was also observed in subjects with the other patterns except for those with the transition to incarceration and continuously homeless patterns. Additionally, this temporary pattern was associated with higher all-cause, drug-related, and HIV-related mortality risks when compared with the continuously homelessness pattern.
This excess mortality risk among adults with a temporary pattern, especially in contrast to those with continuously homeless pattern, might point to health burdens attributed to the revolving-door pattern. Two methods, IPTW and sensitivity analyses, were used to assess whether this observation was potentially the result of residual confounding of unmeasured behaviors, and results from both suggested that the observed associations were robust.
A potential mechanism through which this pattern might affect health is the higher risk of exposure to hazardous environments in the community; the likelihood of a drug overdose could conceivably increase because narcotic abstinence during a jail stay decreases drug tolerance (25). Evidence of excess risk of drug-related death during the time period immediately after release from jails (2) or prisons (26, 27) has been identified in previous United States and United Kingdom studies. Another possible explanation is the disruption of medical care due to transitions from brief jail incarceration or homelessness back into the community. For example, continuity of antiretroviral care is critical for survival among people living with HIV/acquired immune deficiency syndrome (AIDS) (10–12). Lastly, some researchers attribute excess mortality risk among incarcerated or homeless adults to cumulative stress (3, 5). Yet, this explanation seems less convincing than others because a sensitivity analysis among cohort members 25 years of age or younger yielded similar finding. The younger ages of these subjects meant that they had fewer chances to be both incarcerated and homeless, which means that the excess mortality risk for the temporary pattern was unlikely to result from cumulative stress from cycling through incarceration and homelessness. However, the short observation time and lack of data about differential stress levels across trajectory groups precludes exploring this hypothesis directly.
Compared with the general adult population of New York City, subjects with all trajectories except for the transition to incarceration and continuously homeless patterns had an increased risk of drug-related death. This might be due to the fact that adults who were incarcerated later in the 2001–2003 time period were more likely than those other trajectories to remain incarcerated during subsequent 2 years, which might decrease the opportunity to use drugs. For adults with a continuously homeless pattern, an undisrupted exposure to drugs might contribute to retaining a higher level of drug tolerance. In addition, being consistently incarcerated or consistently living in a shelter might increase one's chance of overdosing on drugs. The HIV-related mortality risk was not higher among adults from New York City who had been incarcerated or homeless for a sustained period. During uninterrupted stays, persons with HIV might benefit from medical services or referrals offered in homeless shelters or jail. However, more data about utilization by and delivery of services to New York City jail inmates or shelter users with HIV/AIDS are needed to test this hypothesis.
The present study has some limitations. First, because of the limited data about confounding, inferences from the standardized mortality ratio analysis and the marginal structural modeling could be biased because of residual confounding, despite the findings from the sensitivity analysis. Second, death outcomes were likely to be underestimated because deaths that occurred outside of New York City (i.e., approximately 6.5% of annual deaths among New York City residents according to National Center for Health Statistics) were not captured. This is likely to bias the estimated association toward the null, under the assumption that measurement error is independent of trajectories. Third, because persons who died during 2001–2003 were excluded, the estimated relative risk might be affected by censoring bias. Even if causes of death and baseline characteristics were similar between those who died earlier and those retained, the sensitivity analysis demonstrated that the observed excess drug-related mortality risk became attenuated and nonsignificant after adding those who died earlier to the analyses. Longer follow-up time is required to determine whether censoring bias is present because 1) the sensitivity analysis result is based on a very small number of drug-related deaths and 2) trajectory grouping might not be reliable among subjects who died early in the study period. Fourth, 2 years might not be a sufficient amount of time to assess the risk of death from chronic diseases. The long-term health effects of some trajectories other than the revolving-door pattern might be different from those observed in 2 years. Lastly, the study findings might not be generalizable to incarcerated adults from New York City who have histories of homelessness that were not captured in New York City single adult shelter registries (e.g., street homelessness).
Despite these limitations, our study has several important strengths. First, by linking patterns of incarceration/homelessness with mortality outcomes, we assessed mortality risk associated with complex transitions between jails, homeless shelters, and residences in the community. Specifically, this allowed us to empirically test whether the revolving-door pattern is temporarily associated with adverse health conditions. Second, we explicitly used analytic methods to better explore causal assumptions from analysis of administrative data. While causal inference from observational data is fraught with methodological challenges, these techniques improve the internal validity of measuring the unique health burdens associated with trajectories of jail incarceration/homelessness beyond individual-level risk factors.
In conclusion, 3-year trajectories of jail incarceration and homelessness were independently associated with mortality risk during a 2-year follow-up period among adults from New York City. In particular, adults with sporadic exposure to brief incarceration and homelessness experienced excess risks of all-cause, drug-related, and HIV-related deaths, which implies that life disruption due to brief exposure to these events has a negative influence on health. Our finding suggests that corrections and homeless services agencies should collaborate with community organizations to proactively engage with individuals who briefly stay in jails or shelters to inform the risk of overdose death and strengthen community-linkage services, such as by maintaining drug counseling/therapy and providing supportive housing with drug treatment services. Additionally, an effort to ensure undisrupted social and medical care for people living with HIV/AIDS should be further promoted, as demonstrated in the transitional care coordination program in which jail inmates with HIV/AIDS are contacted regularly to receive community-wide medical and social services (28).
Supplementary Material
ACKNOWLEDGMENTS
Author affiliations: Office of the Executive Deputy Commissioner, Division of Mental Hygiene, the New York City Department of Health and Mental Hygiene, New York, New York (Sungwoo Lim); Bureau of Epidemiology Services, Division of Epidemiology, The New York City Department of Health and Mental Hygiene, New York, New York (Tiffany G. Harris); CUNY School of Public Health, City University of New York, New York, New York (Sungwoo Lim, Denis Nash, Mary Clare Lennon, Lorna E. Thorpe); and Graduate Center, City University of New York, New York, New York (Mary Clare Lennon).
We thank Dr. Regina Zimmerman, Dr. Wenhui Li, and Dr. Gil Maduro for their help with the mortality analysis; Dr. Tejinder Singh for data checking; Jisen Ho for data matching; and Dr. Amber Levanon Seligson, Dr. Dova Marder, Eileen Lynch Johns, Dr. Zhifen Cheng, and Dr. Benjamin Charvat for their helpful comments.
This work was a part of doctoral dissertation research by S.L. (http://works.gc.cuny.edu/cgi/viewcontent.cgi?article=1247&context=etd).
The New York City Department of Health and Mental Hygiene, the New York City Department of Correction, and the New York City Department of Homeless Services provided the data, but the analysis does not necessarily reflect the opinions or conclusions of the New York City Department of Correction and/or its staff.
Conflict of interest: none declared.
REFERENCES
- 1.Kushel MB, Hahn JA, Evans JL, et al. Revolving doors: imprisonment among the homeless and marginally housed population. Am J Public Health. 2005;95(10):1747–1752. doi: 10.2105/AJPH.2005.065094. [DOI] [PMC free article] [PubMed] [Google Scholar]
- 2.Lim S, Seligson AL, Parvez FM, et al. Risks of drug-related death, suicide, and homicide during the immediate post-release period among people released from New York City jails, 2001–2005. Am J Epidemiol. 2012;175(6):519–526. doi: 10.1093/aje/kwr327. [DOI] [PMC free article] [PubMed] [Google Scholar]
- 3.Massoglia M. Incarceration as exposure: the prison, infectious disease, and other stress-related illnesses. J Health Soc Behav. 2008;49(1):56–71. doi: 10.1177/002214650804900105. [DOI] [PubMed] [Google Scholar]
- 4.Schnittker J, John A. Enduring stigma: the long-term effects of incarceration on health. J Health Soc Behav. 2007;48(2):115–130. doi: 10.1177/002214650704800202. [DOI] [PubMed] [Google Scholar]
- 5.Morrison DS. Homelessness as an independent risk factor for mortality: results from a retrospective cohort study. Int J Epidemiol. 2009;38(3):877–883. doi: 10.1093/ije/dyp160. [DOI] [PubMed] [Google Scholar]
- 6.Zlodre J, Fazel S. All-cause and external mortality in released prisoners: systematic review and meta-analysis. Am J Public Health. 2012;102(12):e67–e75. doi: 10.2105/AJPH.2012.300764. [DOI] [PMC free article] [PubMed] [Google Scholar]
- 7.Freudenberg N. Jails, prisons, and the health of urban populations: a review of the impact of the correctional system on community health. J Urban Health. 2001;78(2):214–235. doi: 10.1093/jurban/78.2.214. [DOI] [PMC free article] [PubMed] [Google Scholar]
- 8.Schwartz S, Carpenter KM. The right answer for the wrong question: consequences of type III error for public health research. Am J Public Health. 1999;89(8):1175–1180. doi: 10.2105/ajph.89.8.1175. [DOI] [PMC free article] [PubMed] [Google Scholar]
- 9.Aisenbrey S, Fasang AE. New life for old ideas: the “second wave” of sequence analysis bringing the “course” back into the life course. Sociol Methods Res. 2010;38(3):420–462. [Google Scholar]
- 10.Pecoraro A, Royer-Malvestuto C, Rosenwasser B, et al. Factors contributing to dropping out from and returning to HIV treatment in an inner city primary care HIV clinic in the United States. AIDS Care. 2013;25(11):1399–1406. doi: 10.1080/09540121.2013.772273. [DOI] [PubMed] [Google Scholar]
- 11.Fox AD, Anderson MR, Bartlett G, et al. Health outcomes and retention in care following release from prison for patients of an urban post-incarceration transitions clinic. J Health Care Poor Underserved. 2014;25(3):1139–1152. doi: 10.1353/hpu.2014.0139. [DOI] [PMC free article] [PubMed] [Google Scholar]
- 12.Giordano TP, Gifford AL, White AC, Jr, et al. Retention in care: a challenge to survival with HIV infection. Clin Infect Dis. 2007;44(11):1493–1499. doi: 10.1086/516778. [DOI] [PubMed] [Google Scholar]
- 13.World Health Organization. International Statistical Classification of Diseases and Related Health Problems. Tenth Revision. Geneva, Switzerland: World Health Organization; 2006. [Google Scholar]
- 14.Greenland S, Pearl J, Robins JM. Causal diagrams for epidemiologic research. Epidemiology. 1999;10(1):37–48. [PubMed] [Google Scholar]
- 15.Abbott A, Tsay A. Sequence analysis and optimal matching methods in sociology: review and prospect. Sociol Methods Res. 2000;29(1):3–33. [Google Scholar]
- 16.Robins JM, Hernán MA, Brumback B. Marginal structural models and causal inference in epidemiology. Epidemiology. 2000;11(5):550–560. doi: 10.1097/00001648-200009000-00011. [DOI] [PubMed] [Google Scholar]
- 17.Cole SR, Hernán MA. Constructing inverse probability weights for marginal structural models. Am J Epidemiol. 2008;168(6):656–664. doi: 10.1093/aje/kwn164. [DOI] [PMC free article] [PubMed] [Google Scholar]
- 18.Breslow N. Covariance analysis of censored survival data. Biometrics. 1974;30(1):89–99. [PubMed] [Google Scholar]
- 19.Efron B. The efficiency of Cox's likelihood function for censored data. J Am Stat Assoc. 1977;72(359):557–565. [Google Scholar]
- 20.Hertz-Picciotto I, Rockhill B. Validity and efficiency of approximation methods for tied survival times in Cox regression. Biometrics. 1997;53(3):1151–1156. [PubMed] [Google Scholar]
- 21.Raghunathan TE, Lepkowski JM, Van Hoewyk J, et al. A multivariate technique for multiply imputing missing values using a sequence of regression models. Surv Methodol. 2001;27(1):85–95. [Google Scholar]
- 22.Fleiss JL. Statistical Methods for Rates and Proportions. 2nd ed. New York, NY: John Wiley; 1981. [Google Scholar]
- 23.Schafer JL. Analysis of Incomplete Multivariate Data. London, UK: Chapman Hall; 1997. [Google Scholar]
- 24.Vanderweele TJ, Arah OA. Bias formulas for sensitivity analysis of unmeasured confounding for general outcomes, treatments, and confounders. Epidemiology. 2011;22(1):42–52. doi: 10.1097/EDE.0b013e3181f74493. [DOI] [PMC free article] [PubMed] [Google Scholar]
- 25.White JM, Irvine RJ. Mechanisms of fatal opioid overdose. Addiction. 1999;94(7):961–972. [PubMed] [Google Scholar]
- 26.Binswanger IA, Stern MF, Deyo RA, et al. Release from prison—a high risk of death for former inmates. N Engl J Med. 2007;356(2):157–165. doi: 10.1056/NEJMsa064115. [DOI] [PMC free article] [PubMed] [Google Scholar]
- 27.Farrell M, Marsden J. Acute risk of drug-related death among newly released prisoners in England and Wales. Addiction. 2008;103(2):251–255. doi: 10.1111/j.1360-0443.2007.02081.x. [DOI] [PubMed] [Google Scholar]
- 28.Jordan AO, Cohen LR, Harriman G, et al. Transitional care coordination in New York City jails: facilitating linkages to care for people with HIV returning home from Rikers Island. AIDS Behav. 2013;17(Suppl 2):S212–S219. doi: 10.1007/s10461-012-0352-5. [DOI] [PubMed] [Google Scholar]
Associated Data
This section collects any data citations, data availability statements, or supplementary materials included in this article.