Figure 4.
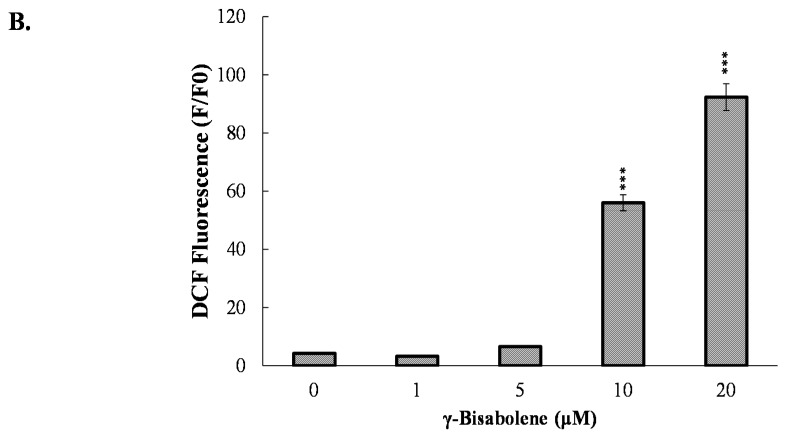
Increase of intracellular ROS production in γ-bisabolene-treated cells. Cells were treated with γ-bisabolene for 48 h, harvested stained using DCF-DA, and then analyzed by flow cytometry with excitation and emission spectra of 495 nm and 529 nm respectively (A); Relative fluorescent intensity of DCF was further calculated (B). ***, p value < 0.001 compared with untreated cells.


