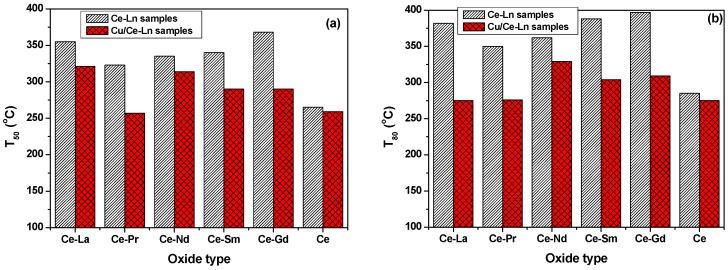
Figure 9.
Comparison of EtOAc performance of CeO2 and Ce-Ln materials, with and without Cu (Ln: Gd, La, Pr, Nd, Sm), in terms of temperature required for 50% (a) and 80% (b) conversion (T50 and T80, respectively). Reaction conditions: [VOC]in = 1000 mgCarbon/m3, GHSV = 60,000 h−1. The error for catalytic experiments is ±2 °C.

