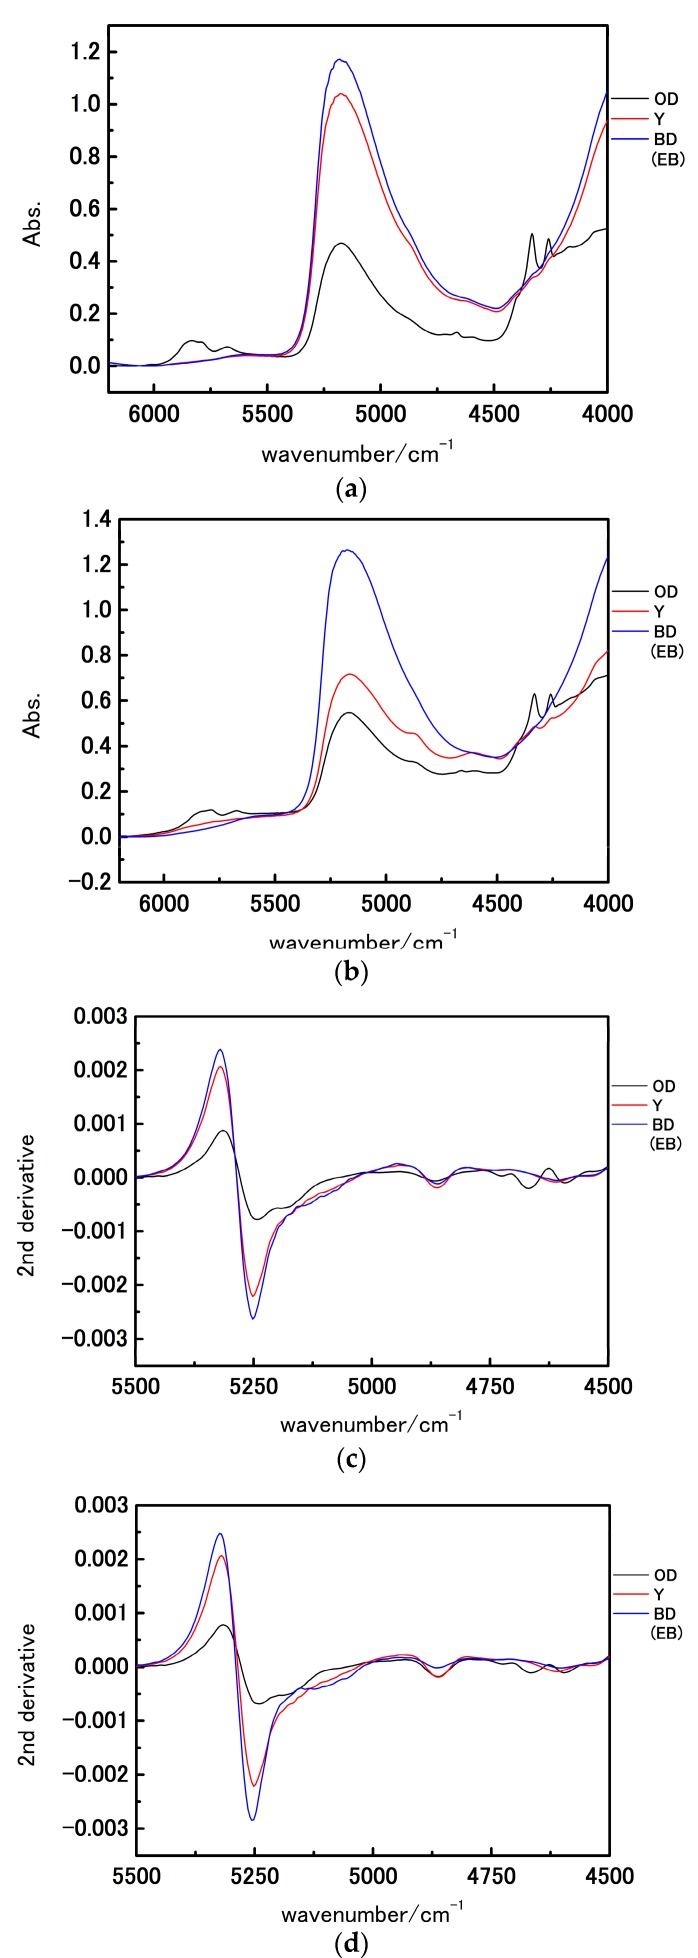
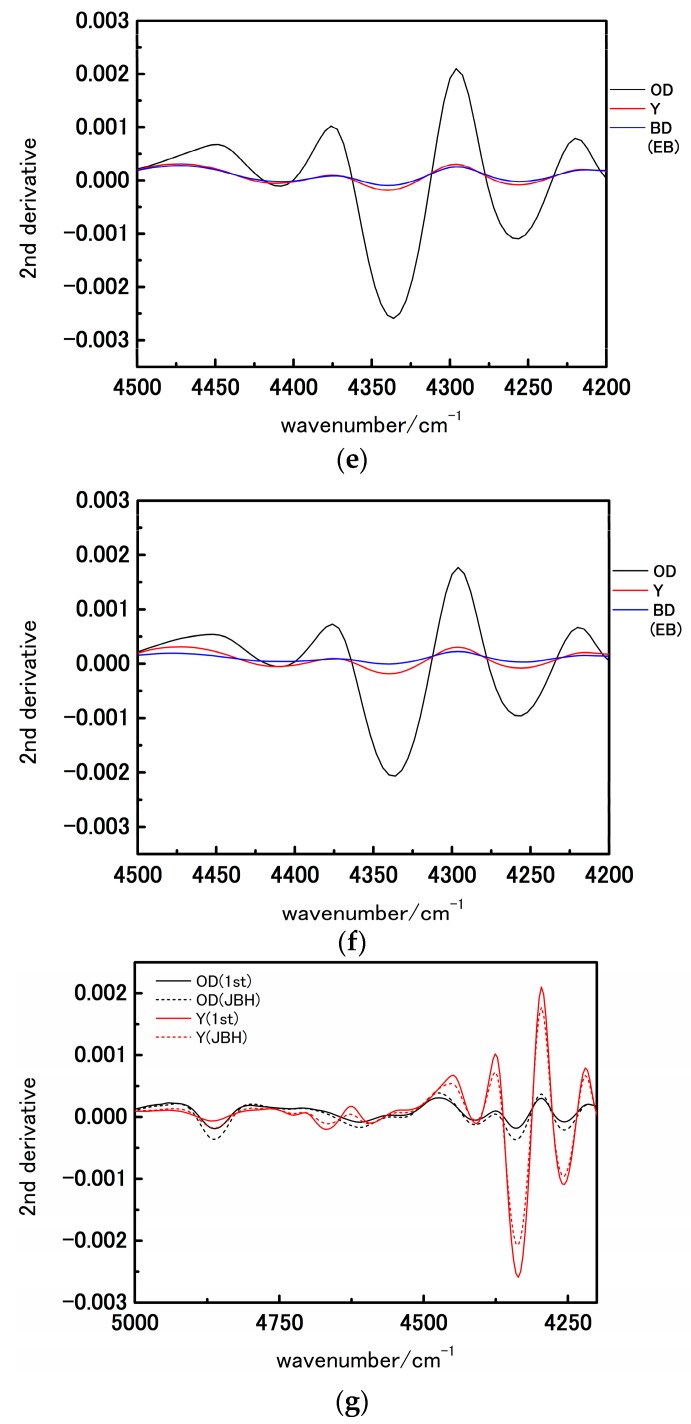
Figure 2.
(a,b) NIR spectra in the 6200–4000 cm−1 region of the oil droplets, egg yolk, and blastodisc (embryonic body) on the fertilization day (first day) and day just before hatching (JBH); (c–f) are second derivatives of the spectra shown in Figure 2a,b in the 5500–4500 cm−1 and 4500–4200 cm−1 regions, respectively; (g) The overlay of the second derivative spectra in the 4900–4200 cm−1 region. (OD: oil droplets, Y: egg yolk, BD: blastodisc, EB: embryonic body).


