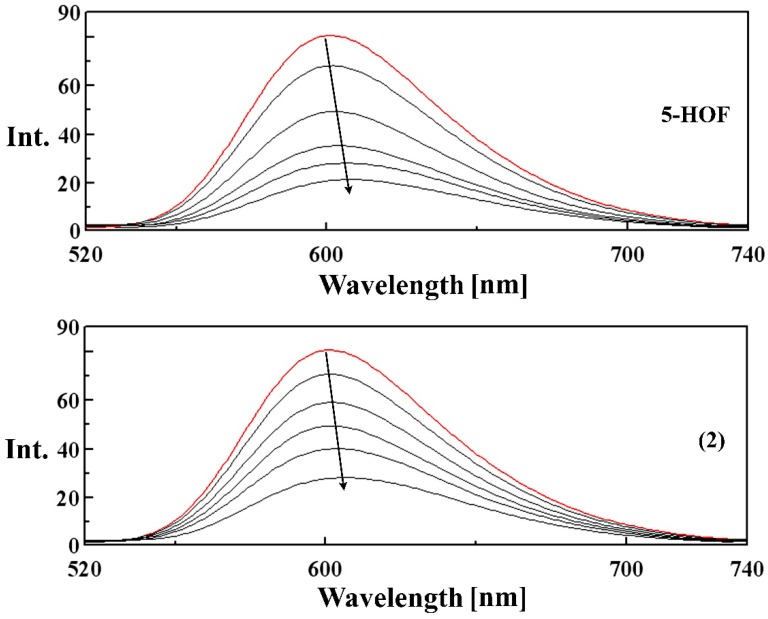
Figure 8.
Fluorescence spectra of the binding of ethidium bromide (EB) to DNA in the absence (red line) and in the presence (black lines) of increasing amounts of the ligand and complex (2) λex = 500 nm, [EB] = 2 μM, [DNA] = 10 μM, [compound] = 10, 15, 20, 25, 30 μM. Arrows indicate the changes in fluorescence intensities upon increasing the amounts of the tested compound.

