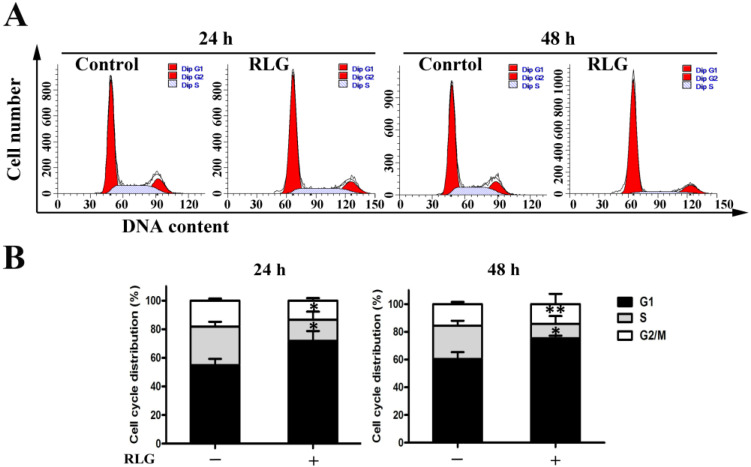
Figure 5.
Effect of riligustilide on the cell cycle in HCT-8 cells. Cells were treated with riligustilide (5 μM) for 24 and 48 h. Then the cells were fixed and stained with PI to analyze DNA content by flow cytometry. (A) Representative histograms of one cell cycle analysis; (B) DNA content of the gated cells ± S.D. of three independent experiments. Student’s t-test was used for two group comparison. * p < 0.05; ** p < 0.01 vs. the control. “+” represents that 10 μM RLG was added, “−” represents control.

