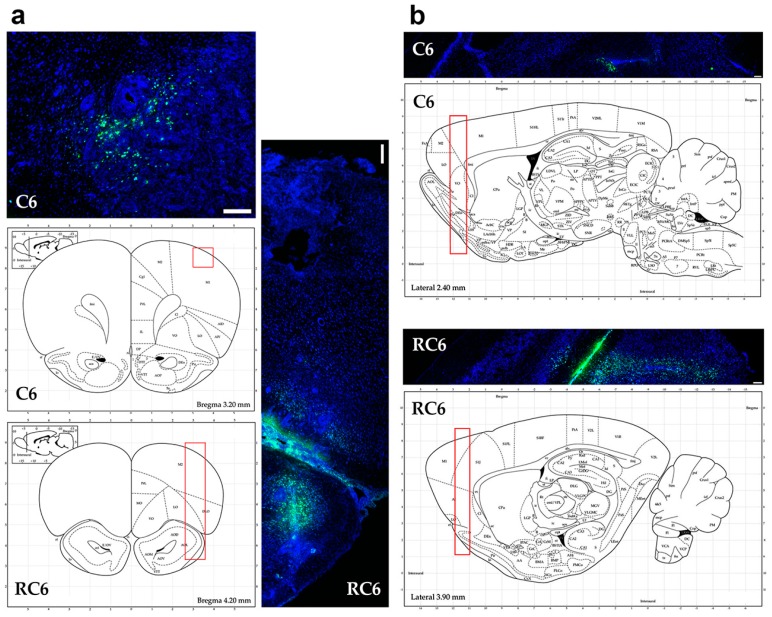
Figure 4.
Invasion of C6 and RC6 cells 10 days after inoculation. (a) Representative images of coronal; (b) and sagittal sections of Wistar rat brain from C6 and RC6 group. Inoculated cells were stained with fluorescent dye FB (green). Nuclei were counterstained with PI (blue). Scale bar = 200 μm. Rat brain schemes were taken from Rat Brain Atlas [18].

