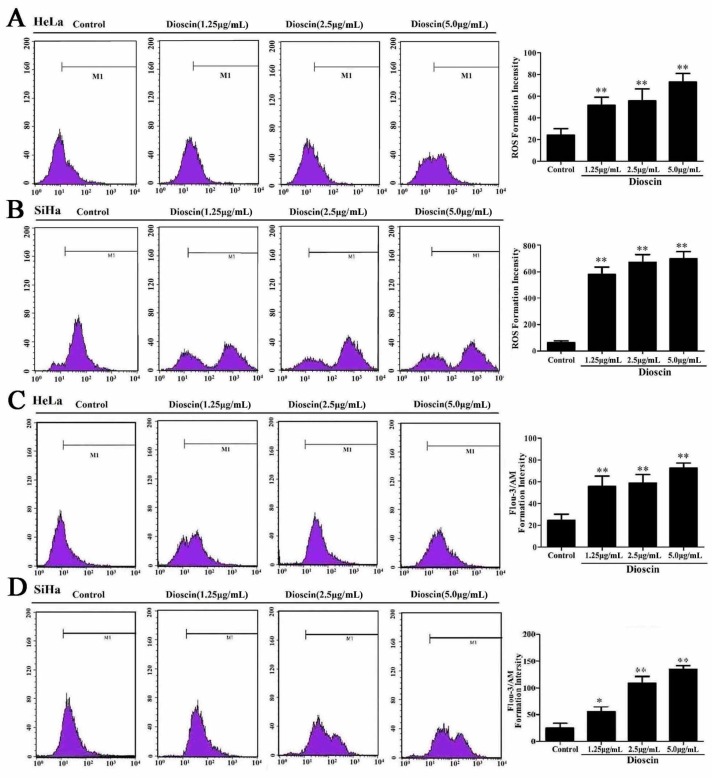
Figure 5.
Effects of dioscin on ROS levels and Ca2+ release. (A) ROS generation in HeLa cell treated by dioscin; (B) ROS generation in SiHa cell treated by dioscin; (C) Effects of dioscin on Ca2+ level in HeLa cells by flow cytometry; (D) Effects of dioscin on Ca2+ level in SiHa cells by flow cytometry. Data are presented as mean ± SD (n = 5). * p < 0.05 and ** p < 0.01 compared with control group.

