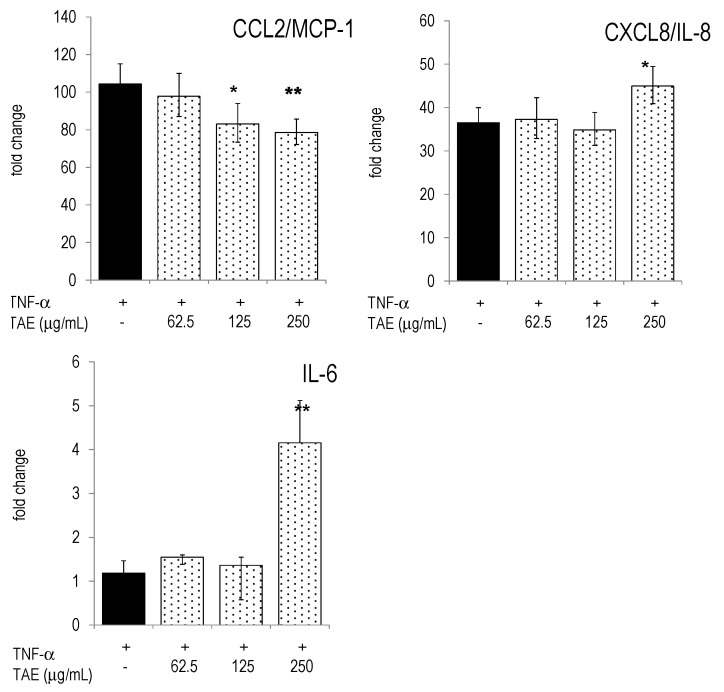
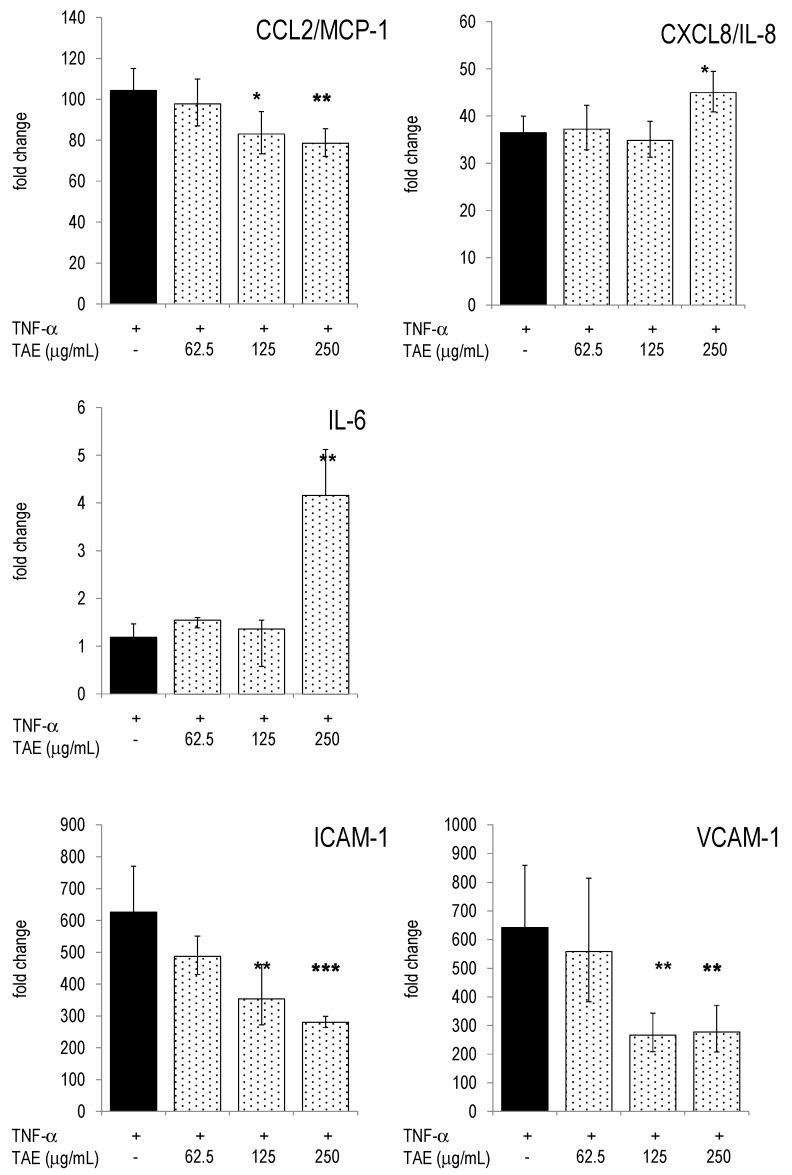
Figure 6.
HUVECs were incubated with TAE, activated with 10 ng/mL TNF-α and cultured for 4 h. Gene expression was quantified by RT-PCR and the data expressed as fold change compared to levels observed in unstimulated cells. Mean ± standard errors of duplicates are given. * p < 0.05, ** p < 0.01, *** p < 0.001 (vs. TNF-α-stimulated cells).


