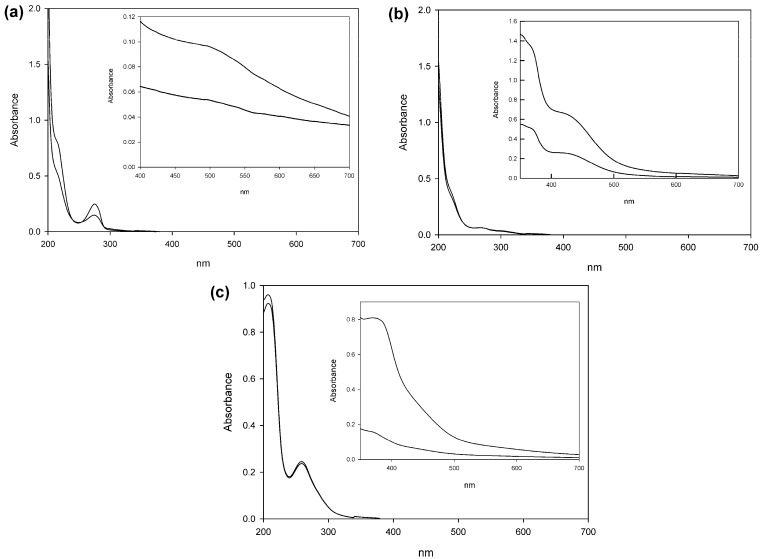
Figure 2.
UV-Vis spectra of polymerization or dimerization products with catechol (a); pyrogallol (b); and gallic acid (c) as starting monomers. Grey lines represent the control reactions where laccase was substituted with heat-inactivated enzyme, while black lines represent the reaction mixtures after 24 h. The UV-Vis spectra presented correspond to 100-fold diluted samples, while in the inlets the spectra were recorded without any dilution.

