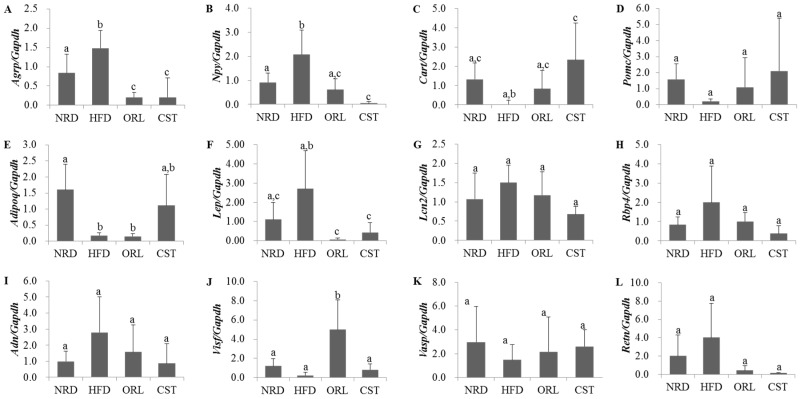
Figure 4.
Expression levels of neuropeptides and adipokines: (A–D) Gene expression levels of neuropeptides in hypothalamus (n = 6); (E–L) Gene expression levels of adipokines in adipose tissues (n = 3). Levels of mRNAs were measured by qRT-PCR and the fold values were normalized using the house keeping gene Gapdh. Data represented as mean ± SD (n = 3–6). Different letters above bars indicate significant difference from each other at p < 0.05 as determined by one-way ANOVA with Least Significant Difference (LSD) post hoc test.

