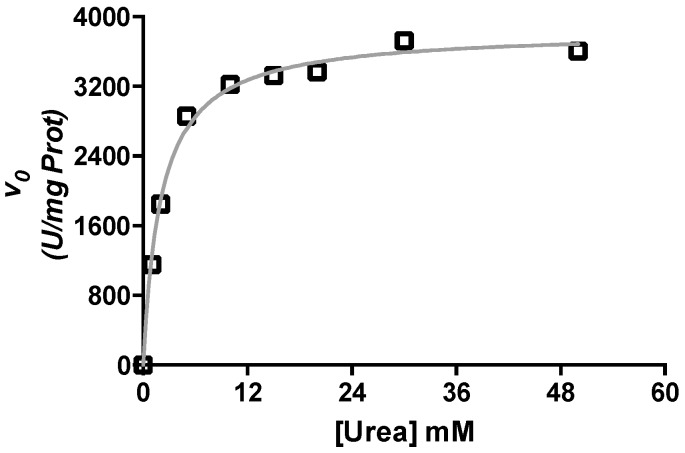
Figure 1.
Saturation kinetics of Citrullus vulgaris urease (CVU) by urea. The observed initial velocities of reaction are plotted against diferent concentrations of urea. U is defined as the amount of enzyme that produces one micromol of NH3+ min−1·mL−1. The grey line shows the best curve fitting to Equation (1). Non-linear curve fitting and plot were prepared using Graph Pad Prism 5® (GraphPad Software, Inc., La Jolla, CA, USA) and one of three typical experimental results is used here as indicated in the Methods section.

