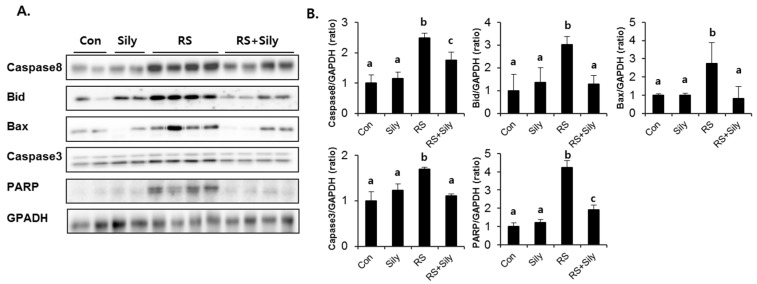
Figure 6.
Silymarin treatment reduced restraint-induced apoptotic cascade. (A) Immunoblot analysis of caspase8, Bid, Bax, caspase3, PARP, and GAPDH. (B) Quantitative analysis of blots. Each value is the mean ± SD for four mice. Values with different letters (a, b) are significantly different from one another (one-way ANOVA followed by Newman-Keuls multiple range test, p < 0.05). CON; control mice, Sily; only silymarin-treated mice, RS; restraint stressed mice, RS + Sily; restraint-stressed mice with silymarin treatment.

