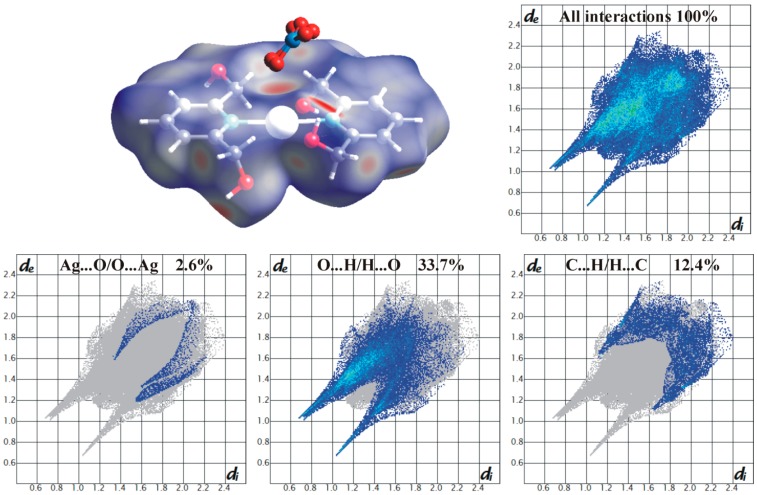
Figure 3.
Hirshfeld surface of Ag(I) complex-cation molecule with the geometrical function dnorm mapped onto it (a colour scale from red to blue: −0.75 Å–1.2 Å) and corresponding finger plots indicating all types of contacts and these reduced to contact types as following Ag···O/O···Ag, O···H/H···O, C···H/H···C [the distances from a surface point to the nearest interior/exterior atoms (di/e) are given in Å].

