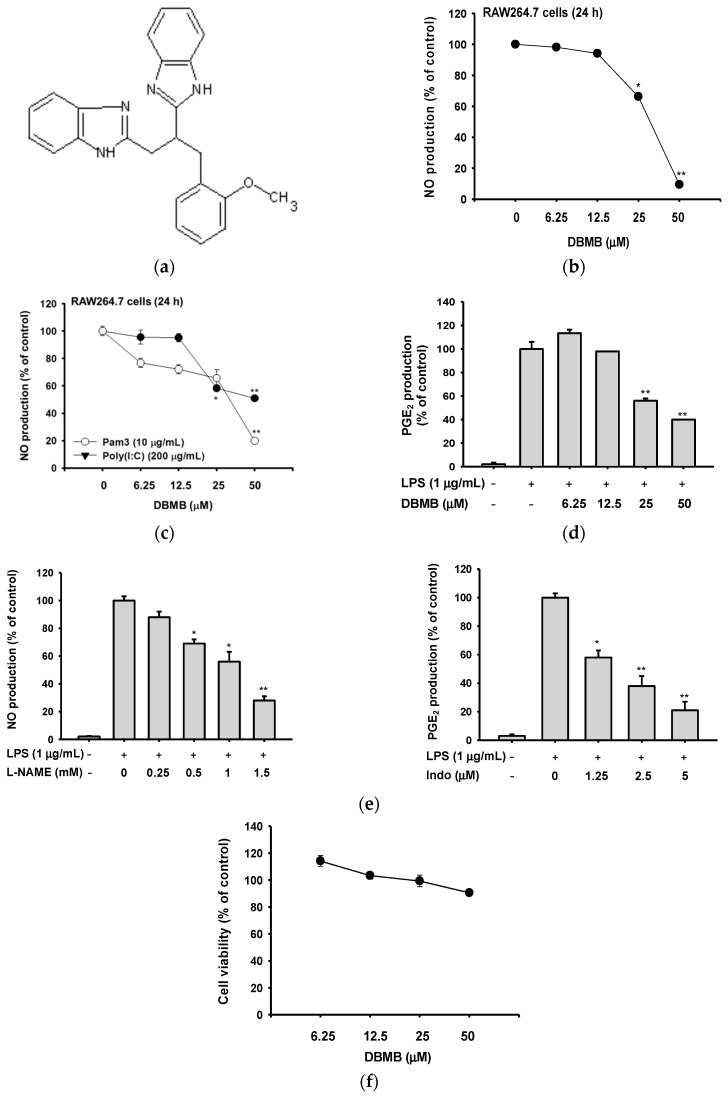
Figure 1.
The structure of DBMB, and its effect on production of inflammatory mediators and cell viability. (a) The chemical structure of DBMB. (b, c, and e left panel) The NO production level was determined by Griess assay using RAW264.7 cells culture supernatants treated with DBMB or l-NAME and immune stimulant molecules. (d and e right panel) The level of PGE2 production was analyzed by ELISA using cell culture supernatants of RAW264.7 cells treated with DBMB or Indo (indomethacin) and LPS (1 μg/mL). (f) Cell cytotoxicity of DBMB was tested by MTT assay. All values (b–f) are presented as means ± standard deviations (SDs). * p < 0.05 and ** p < 0.01 compared with controls.

