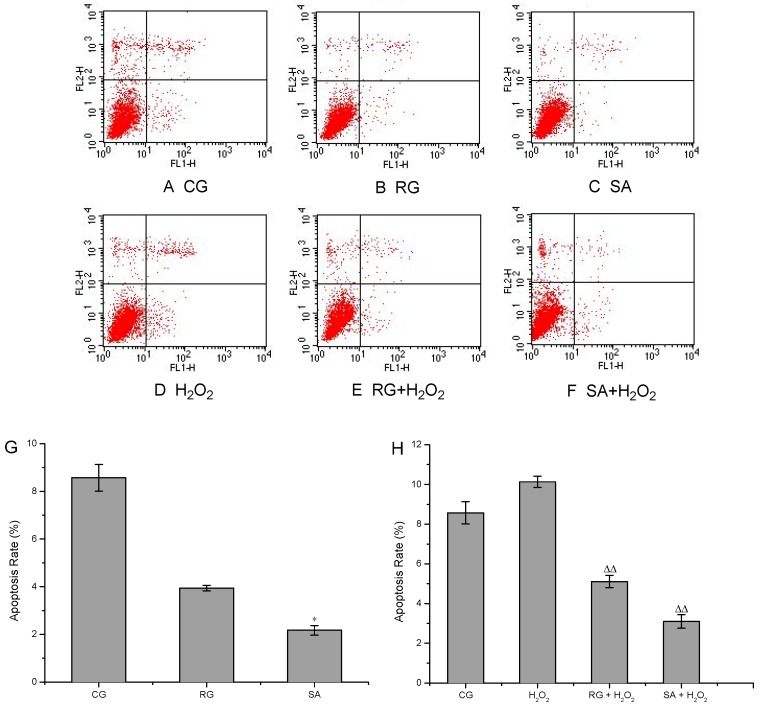
Figure 3.
Apoptosis analysis of HUVECs in response to striatisporolide A (SA) by flow cytometry. A–C: Flow cytometric analysis of cells untreated with H2O2. D–F: Flow cytometric analysis of cells treated with H2O2. G: Apoptosis rate in cells untreated with H2O2. H: Apoptosis rate in cells treated with H2O2. CG represents as control group. RG represents as positive control group. H2O2 represents as the group treated with H2O2 alone. Values are means ± SD (n = 3). Compared with the control group (* p < 0.05). Compared with the H2O2 group (∆∆ p < 0.01).

