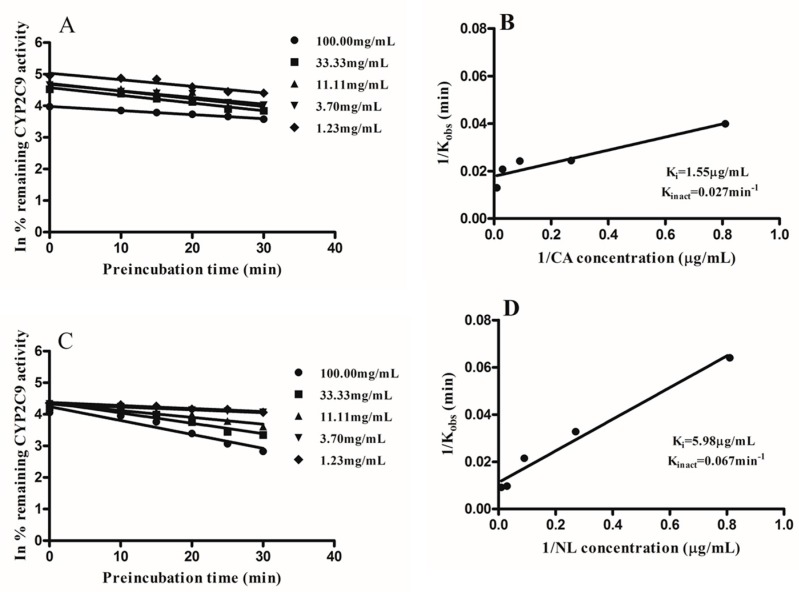
Figure 6.
Double reciprocal plots of Kobs and inhibitor concentrations were plotted to determine the inactivation parameters Ki and Kinact on CYP2C9 activity by Newbouldia laevis (NL) and Cassia abbreviata (CA). (A,B) represent Kobs and double reciprocal curve plots CA, respectively; (C,D) represent Kobs double reciprocal curve plot NL, respectively.

