Abstract
In this paper, we report the results of Monte Carlo simulations of the adsorption of neon, argon, methane and carbon dioxide in carbon nanohorns. We model the nanohorns as an array of carbon cones and obtained adsorption isotherms and isosteric heats. The main sites of adsorption are inside the cones and in the interstices between three cones. We also calculated the selectivity of carbon dioxide/methane, finding that nanohorns are a suitable substrate for gas separation. Our simulations are compared to available experimental data.
Keywords: adsorption, carbon nanohorns, carbon dioxide
1. Introduction
The investigation of adsorption phenomena has been a very exciting and successful scientific activity in the last half-century [1,2,3,4,5,6,7,8,9]. In recent years, a considerable amount of work has been devoted to investigate, theoretically and experimentally, the physical adsorption in bundles of carbon nanotubes and carbon nanohorns [10,11,12,13,14,15,16,17,18,19,20,21]. The separation of gas mixtures has become a widespread practice used in industry and society. Some examples of the applications of gas separation include: the purification of natural gas and air, the sequestration of CO, CO and other harmful gases and the production of H. Within the last decade, environmental efforts have focused heavily on the reduction of CO in the atmosphere. The motive for targeting CO is a result of its “greenhouse gas effect” and its contribution to global warming.
Procedures for the separation of gases have also gained wide attention due to the importance that CO and H have managed to play in society. CO, for example, is a valuable material for the synthesis of a variety of chemicals. In many instances, synthesized CO contains several impurities, such as CO, N, H, CH and HO, which requires purification through gas separation methods. Furthermore, in the development of a hydrogen-based economy, the efficient production of H represents an issue for commercial applications. Regardless of the mechanism, H purification ultimately equates to a CO removal process. Within the arena of gas separation techniques, carbon nanohorns are a promising material.
“Physical adsorption” (physisorption) is a term applied to atoms or molecules that are weakly bound to surfaces. Physisorption has been extensively explored for more than half of a century because of interest in both potential applications and basic science. These applications include the separation of cryogenic gases, their storage and their use as surface characterization tools, such as the measurement of the surface area of porous media by nitrogen adsorption. The science of physisorption encompasses a wide variety of fundamental questions, including many related to phase transitions. Adsorption studies also serve a crucial purpose in fundamental and applied characterization of porous materials. In particular, nitrogen adsorption at 77 K is routinely used for the characterization of porous structure. In the case of substrates with pore dimensions <0.5 nm, activated diffusion may occur at 77 K [22], thereby preventing the observation of nitrogen uptake. In these circumstances, the adsorption of carbon dioxide at 273 K may be used as a routine measurement of micropore volume. Adsorption studies also increase the scientific community’s understanding of substrates when they are correlated with experimental results. The properties of adsorbates are thus one of the aspects of nanomaterials that needs to be assessed to enable its applications and to help bring its use in new technologies closer.
Gas separation by adsorption can be accomplished by three basic physical mechanisms: equilibria, kinetics and steric effects [23]. Equilibrium mechanisms rely on the strength of attraction between gas molecules and their substrate, while kinetic mechanisms involve the differences in the adsorption and transport rates of a gas on and through its substrate. Steric mechanisms, on the other hand, depend on the incompatibility between the size or shape of the adsorbate gas molecules and the pores of the substrate. For instance, since CO is typically found in a mixture with gases of similar size (for example, CH and H), steric separation is not effective. However, CO possesses the strongest, attractive interactions with many substrates. For example, the energy of interaction of CO with graphene is twice as strong as CH with graphene [24]. As a result, the equilibrium mechanism presents the most plausible strategy.
Adsorption selectivity in a binary mixture of components i and j is defined as:
| (1) |
where and are the molar concentrations of species i in the adsorbed phase and vapor phase, respectively. The concentration in the adsorbed phase, , can be obtained from Monte Carlo or molecular dynamics simulations.
We can also estimate the selectivity of mixtures by the commonly-used “Ideal Adsorbed Solution Theory” (IAST) [25]. In the IAST, the selectivity is calculated using the data of the adsorption of the pure components, thus being a simple approach. Unfortunately, it may not be accurate for some mixtures that differ strongly in size or polarity. However, Babarao et al. confirmed that the theory is indeed reliable in the case of mixtures CO + CH in IRMOFs [26].
The specification of an appropriate adsorbent is the key for separation by adsorption. Although, currently, there are materials that are useful for gas separation, research in this area continues in order to optimize the performance of current materials and to examine a wider range of new sorbents. Many substrates have been used for this purpose, for example carbon nanotubes, activated carbons, zeolites and metallic organic frameworks.
Carbon nanohorns resemble short, wide, highly-defected single-walled nanotubes that end in a conical tip (“horns”) [27]. In contrast to regular nanotubes that assemble into parallel bundles, nanohorns form spherical aggregates with the nanohorns arranged along radial directions. The center of these aggregates is, in most cases, hollow. The body of the nanohorn is more or less cylindrical, with typical lengths between 30 and 70 nm and with a diameter that varies irregularly along its length (typical nanohorn diameters are between 3 and 8 nm). The diameters of these spherules are typically 80 to 100 nm.
Using the simulation technique grand canonical Monte Carlo (GCMC), we obtained the adsorption isotherms of Ne, Ar, CH and CO in an array of carbon nanohorns. We estimated the selectivity for CO based on the IAST approximation.
This article is organized as follows: In Section 2, we explain the method and the model. In Section 3, we describe our results, and in Section 4, we present our conclusions.
2. The Model
In the numerical study of adsorption, the following experiment is simulated: the substrate is exposed to a vapor at constant P and T. After some time passes, long enough to reach equilibrium, the uptake is measured under those P and T conditions. This can be simulated numerically by the methods of Grand Canonical Monte Carlo (GCMC) or Molecular Dynamics (MD) [28].
The GCMC method is based on statistical mechanics theory. The uptake is obtained at any given temperature and the chemical potential of the adsorbate. The chemical potential of the adsorbate is identical to that of the vapor, since both are in thermal equilibrium, and the last one is related to the pressure of the vapor, through the equation of state.
The inputs the data of the simulation are the pressure of the vapor, the temperature and the intermolecular forces. The output data of the simulation are the average number of adsorbed atoms (N), the averages of the total energy, the energy gas-surface () and the energy gas-gas (). We also collect samples of the coordinates for each of the adsorbed atoms. For each single data point in the isotherms , we typically run MC moves to reach equilibrium, and moves are performed for data collection. The ratio of creation/deletion/translation moves is 0.40/0.40/0.20. For details on the method, we refer the reader to [18].
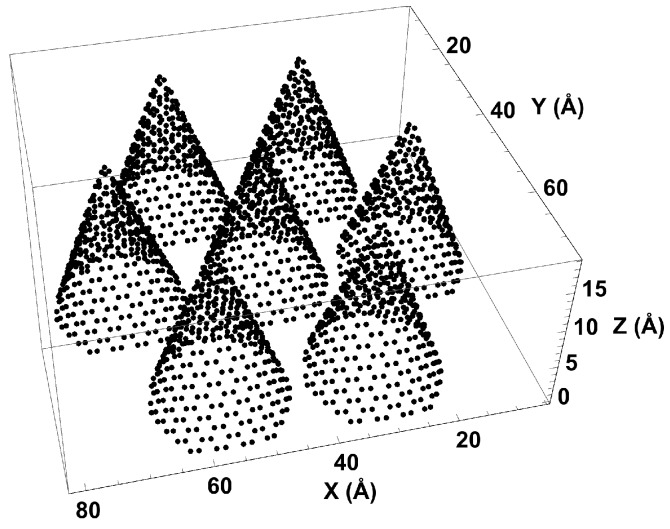
Carbon nanohorns have two main sites of adsorption: inside the cones near the tip and in the external interstices between cones. We designed a simple version of the nanohorns, consisting of an array of seven “graphene” cones on the 8.0 nm × 8.7 nm base of the simulation cell (see Figure 1). The cones are identical, with 2 nm-diameter bases and 1.5-nm heights. Although the model lacks the spherical curvature typical of a dahlia-shaped arrangement, it holds the main features that are important for adsorption: interstices and conical tip. The boundary conditions are set reflective in the z direction and periodic in .
Figure 1.
Simulation cell with seven nanohorns.
We compute the adsorption potential as the pairwise sum of two-body interactions between individual carbon atoms and the adatom,
| (2) |
For Ar, Ne and CH, we use the Lennard–Jones (LJ) potential to model the adsorbate-adsorbate and adsorbate-carbon interactions.
The CO molecule was represented as a rigid three-site linear molecule with partial charges in each site [29,30], and and a bond length of 1.18 Å. These parameters were set to mimic the molecular quadrupole moment, B. The interaction energy between a CO molecule and each carbon atom in the nanohorn is the sum of LJ terms:
| (3) |
while the CO-CO interaction is obtained as a sum of the LJ and electrostatic Coulomb terms:
| (4) |
These sums are done over the carbon and oxygen atoms in the CO molecule.
The LJ parameters for the adatom-C potential are obtained by fitting the physical properties of the gases and using semi-empirical combining rules: and [31], with Å and K [17,32].
The LJ parameters are exhibit in Table 1.
Table 1.
Lennard–Jones (LJ) parameters used in the simulations.
3. Results
The simulations were done for Ne, Ar, CO and CH. The results are described below.
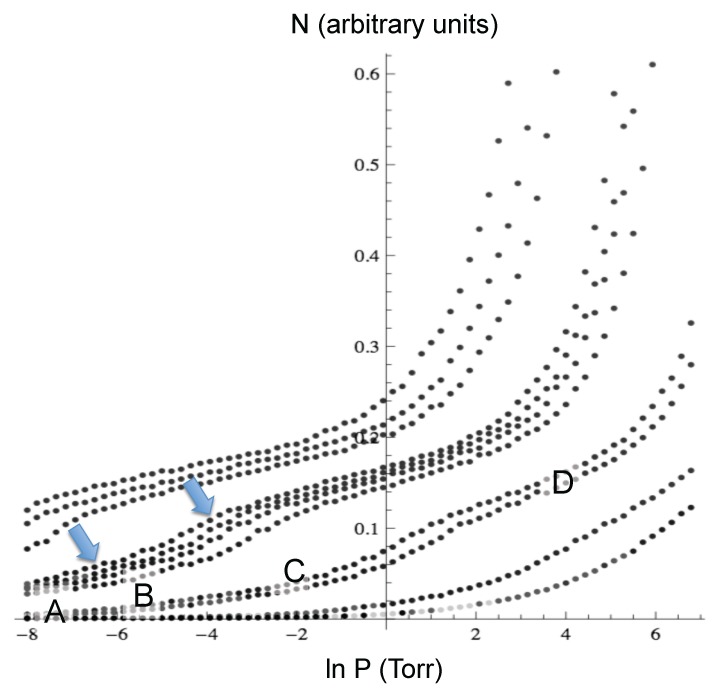
Neon: Figure 2 shows the adsorption isotherms for Ne at temperatures between 18.7 K and 49.8 K, and Figure 3 shows the neon atoms in the simulation cell at four different conditions as labeled A to D in Figure 2. At the lowest coverage, the neon atoms are adsorbed in the most attractive sites, which are inside the cones (labeled A in the isotherms). At higher pressure, the adsorption occurs both inside and in the external interstices (label B). Adsorption continues to increase until the least attractive sites are populated, which are the walls of the cones opposite the interstices (label C), and finally, a “monolayer” forms covering all of the exterior of the cones (label D). The isotherms show a clear “bump” between C and D, similar to a monolayer completion usually seen in adsorption experiments, and another almost imperceptible bump at low coverage. The experiments reported in [19] show two bumps, as well. The pressure at which the condensation starts in the simulations is similar to the one in the experiment at the same temperature. However, in the simulations, the condensation step is less abrupt.
Figure 2.
Adsorption isotherms for Ne at temperatures between 18.7 K and 49.8 K. The arrows indicate the bumps, and the labels A to D correspond to the configurations shown in Figure 3.
Figure 3.
Sample configurations (at T, P conditions, indicated by the labels A to D in Figure 2 showing Ne atoms inside the cones (red) or outside (green).
The quantum effects on the Ne isotherms are small. We conclude this after calculating the upper limit to both the Boer parameter Γ and the zero-point energy (ZPE). Those correspond to the “worst-case scenario” in our simulations, that is K and Ne-Ne separation , in which case, we obtain and ZPE K (much smaller than the thermal, Ne-Ne and Ne-graphene energies).
We computed the isosteric heat of adsorption from the isotherms, to compare to the experimental results from [19].
The isosteric heat of adsorption, , is defined as:
| (5) |
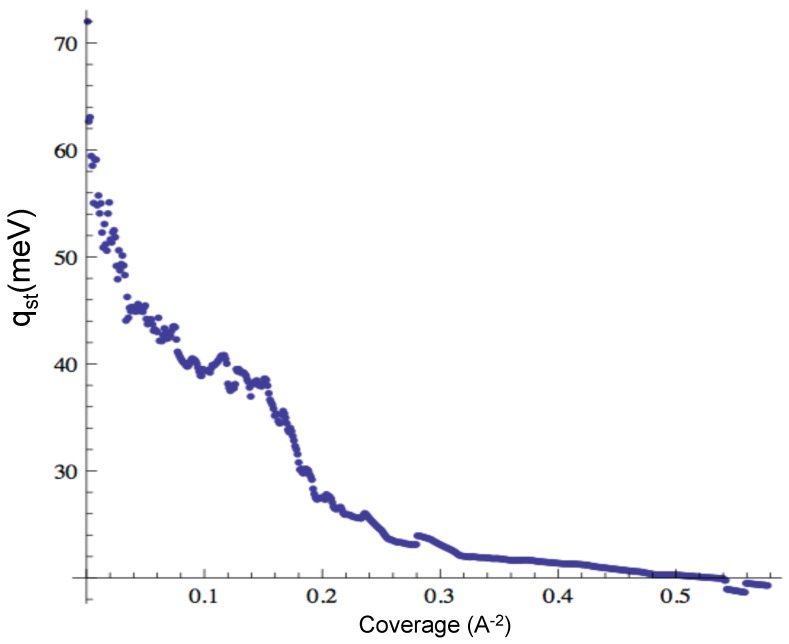
where n is the coverage and P is the vapor pressure at the given . We compute the from the adsorption isotherms at a constant value of n. The result is displayed in Figure 4, which can be compared to the experimental result from [19].
Figure 4.
Isosteric heat of adsorption of Ne.
We observe a plateau at approximately 20 meV, similar to the experimental value (21 meV). However, the peak value in our simulations is higher than in the experiment (37.5 meV). This indicates an overestimation of the adsorption energy inside the cones, probably an effect of the “pointy shape” of the cones.
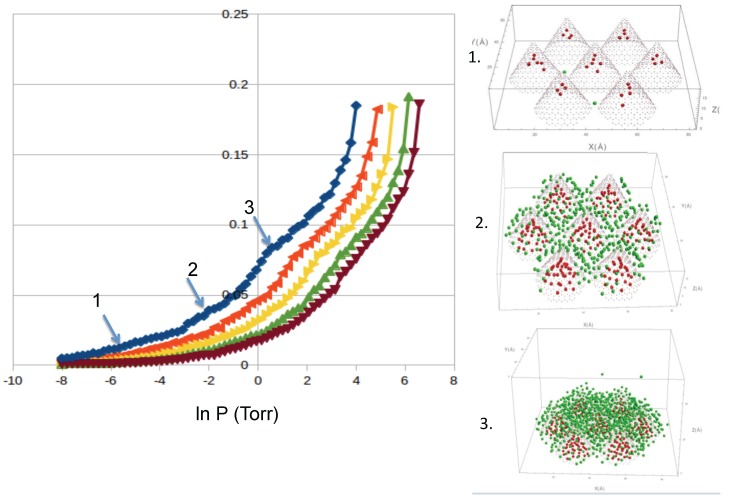
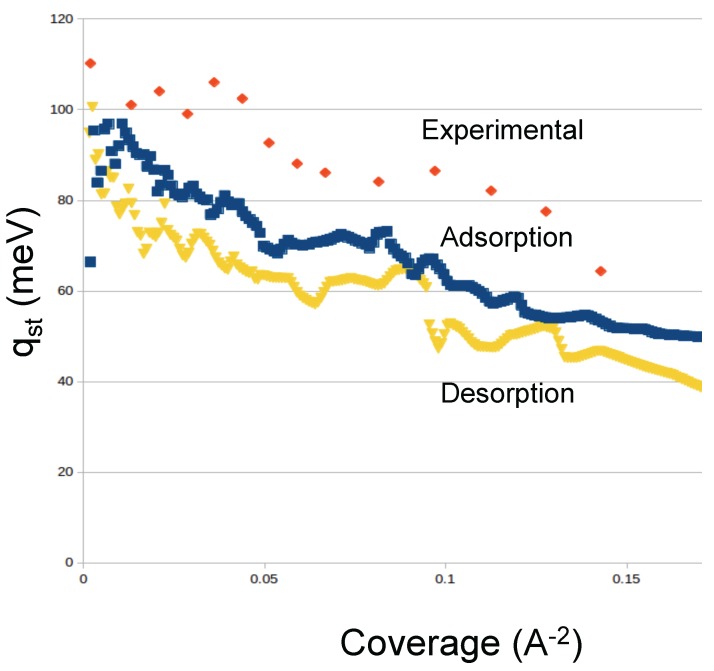
Argon: We simulated the adsorption of Argon at temperatures from 70 to 91 K in order to be able to compare to the available experimental data. Our results for Ar show similar features as Ne and reasonable agreement with the experimental results from Calvillo et al. [20]. We show the results in Figure 5. We identify two “bumps” at low coverage and medium coverage. In our simulations, the first bump corresponds to the occupancy of the interstices, and the second bump to the complete coverage of the external sites. We also see that the condensation in the cell starts at similar pressures as in the experiment [20]. The desorption isotherms show a slight hysteresis in the condensation regime. We also computed the isosteric heat of adsorption, shown in Figure 6. We find that the values of obtained in our simulations for both adsorption and desorption are lower than the experimental q [20]. We believe that the reason for the discrepancy is the simplicity of our nanohorns.
Figure 5.
Adsorption isotherms of argon (in Å), at temperatures of 70.32, 81.51, 86.45 and 91.13 K (from left to right). Also shown are configurations at low (1); medium (2) and high (3) coverage, as labeled. Color code: atoms inside the cones (red) and outside (green).
Figure 6.
Isosteric heat of adsorption and desorption of argon. Also shown are the experimental data from [20].
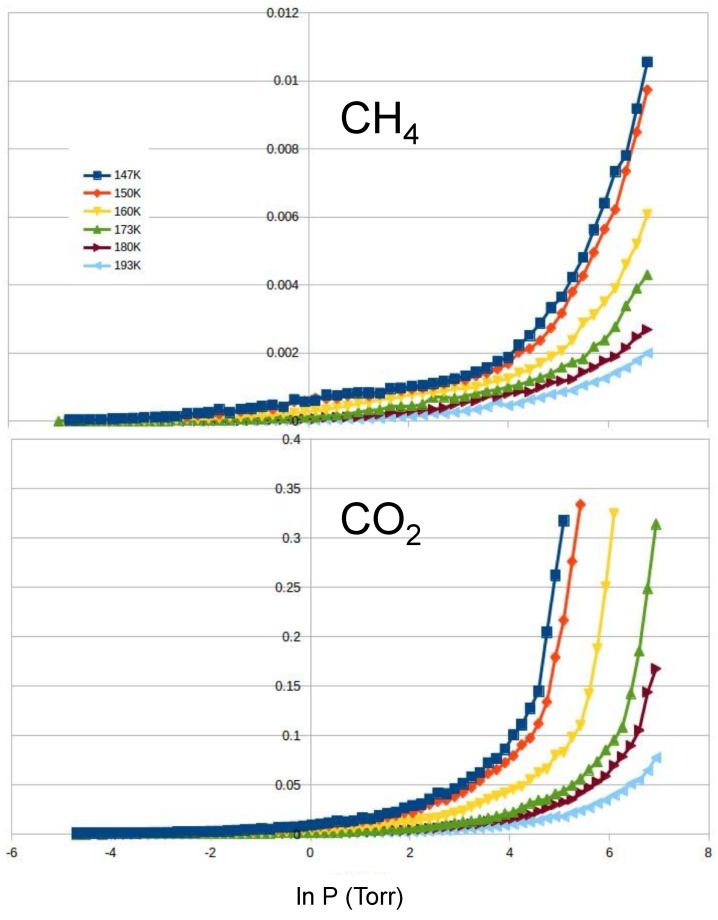
CO and CH: In order to address the selectivity of mixtures, we run simulations for pure carbon dioxide and pure methane at temperatures from 143 to 193 K (see Figure 7). We found that CO is adsorbed at significantly lower pressure than CH. As a result, the substrate adsorbs CO with high selectivity. From our isotherms and using the IAST approximation, we estimate the values of : 25, 23, 16, 10, 8 and 6, for temperatures of 143 K, 150 K, 160 K, 173 K, 180 K and 193 K, respectively.
Figure 7.
Adsorption isotherms (in arbitrary units) of methane (top) and carbon dioxide (bottom) at temperatures of 147, 150, 160, 173, 180 and 193 K from left to right.
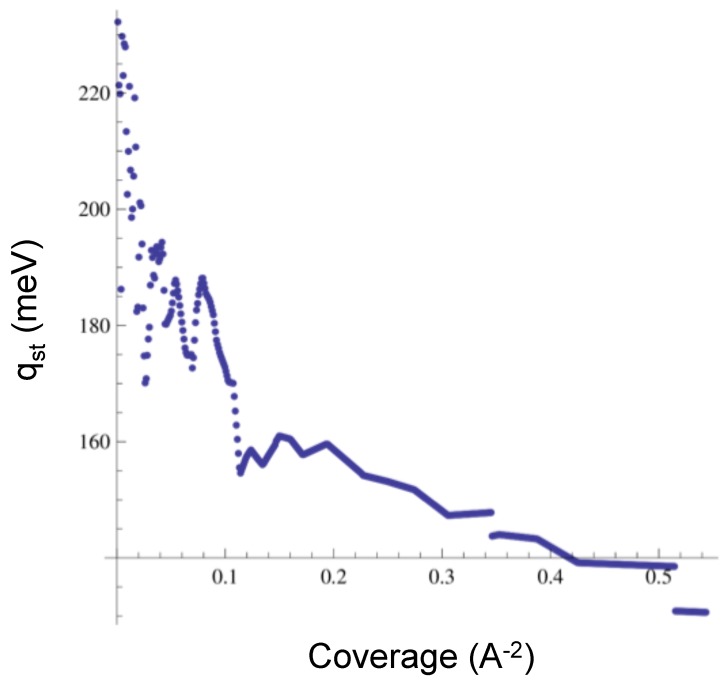
We also obtained the isosteric heat of adsorption for CO, which we display in Figure 8 for low to medium coverage. The low coverage limit is 230 meV, and the medium coverage value is near 140 meV. These values are lower than the experimental data, which range from 237 to 280 meV [21]. However, we find agreement with the experiment in the fact that the isotherms for CO are smooth (no sub-steps or bumps), unlike the isotherms for Ar or Ne. The isosteric heat does not show a “u” shape like the experimental reported in [21]. In order to address this feature, we should obtain the values of the at higher coverage, a regime in which we have no results to report yet.
Figure 8.
Isosteric heat of adsorption for CO.
4. Conclusions
We have simulated the adsorption of neon, argon, carbon dioxide and methane in a simplified version of carbon nanohorns. Given the approximations made in our model, we have found close agreement with the experimental data available. The main simplification of our model is that there are only seven identical cones arranged on a flat lattice repeated periodically, while the real substrate is a spherical array of cones with different sizes and aspects.
The coincidences with the experimental data are many. For example, the isotherms of neon and argon feature bumps similar to those in the real substrate. Hence, we can conclude that those bumps observed in the experiment correspond to adsorption in the internal tip and interstices. The isotherms of carbon dioxide, on the contrary, are smooth, implying that internal and interstitial sites may have similar energies. The quantitative agreement is better for neon and argon than for CO. One possible reason is that the adsorption of Ne and Ar is highly dominated by the two first sites, while for CO, the external surface may be more significant. One of the simplifications of our model is that the substrate has only seven cones with three interstices; hence, the “exterior” is overexposed.
We also estimated, using the IAST, a high selectivity of CO/CH. A more precise calculation would require a heavier computation, either MC or MD of the CO + CH mixture on a more realistic substrate. Our results can be used as a guide to the conditions of temperature and vapor pressure in which those calculations would be worth it.
Acknowledgments
S.G. and A.N. thank the financial support provided by the National Science Foundation, Partnership for Reduced Dimension Materials (PRDM), NSF Grant No. DMR1205608. S.G. thanks the financial support provided by the National Science Foundation Grant No. DMR-1006010 and DMR-1231319 . SG and AS thank the financial support provided by the National Science Foundation (Award No. NSF PHY-1358727) for the REU site in Physics at Howard University. We thank María M. Calbi and Aldo D. Migone for fruitful comments and discussions.
Author Contributions
A.S. ran the simulations and analyzed the data of neon and carbon dioxide. A.N. ran the simulations and analyzed the data of argon and methane. S.G. coordinated, supervised and wrote the article.
Conflicts of Interest
The authors declare no conflict of interest.
Footnotes
Sample Availability: Not available.
References
- 1.Toigo F., Cole M.W. Model adsorption potentials for He and Ne on graphite. Phys. Rev. B. 1985;32:6989. doi: 10.1103/PhysRevB.32.6989. [DOI] [PubMed] [Google Scholar]
- 2.Boninsegni M., Cole M.W., Toigo F. Helium adsorption on a Lithium substrate. Phys. Rev. Lett. 1999;83:2002. doi: 10.1103/PhysRevLett.83.2002. [DOI] [Google Scholar]
- 3.Ancilotto F., Toigo F. First-principles study of potassium adsorption on graphite. Phys. Rev. B Condens. Matter. 1993;47:13713. doi: 10.1103/PhysRevB.47.13713. [DOI] [PubMed] [Google Scholar]
- 4.Calbi M., Toigo F., Cole M.W. Dilation and intercalation of gases within carbon nanostructures. J. Low Temp. Phys. 2002;126:179–186. doi: 10.1023/A:1013747724321. [DOI] [Google Scholar]
- 5.Dillon A., Jones K., Bekkedahl T., Kiang C., Bethune D., Heben M. Storage of hydrogen in single-walled carbon nanotubes. Nature. 1997;386:377–379. doi: 10.1038/386377a0. [DOI] [Google Scholar]
- 6.Chambers A., Park C., Baker R., Rodriguez N. Hydrogen storage in graphite nanofibers. J. Phys. Chem. B. 1998;102:4253–4256. doi: 10.1021/jp980114l. [DOI] [Google Scholar]
- 7.Inoue S., Ichikuni N., Suzuki T., Uematsu T., Kaneko K. Capillary condensation of N2 on multiwall carbon nanotubes. J. Phys. Chem. B. 1998;102:4689–4692. doi: 10.1021/jp973319n. [DOI] [Google Scholar]
- 8.Teizer W., Hallock R., Dujardin E., Ebbesen T. 4He Desorption from single wall carbon nanotube bundles: A one-dimensional adsorbate. Phys. Rev. Lett. 1999;82:5305–5308. doi: 10.1103/PhysRevLett.82.5305. [DOI] [Google Scholar]
- 9.Weber S., Talapatra S., Journet C., Migone A.D. Determination of the binding energy of methane on single-walled carbon nanotube bundles. Phys. Rev. B. 2000;61:13150. doi: 10.1103/PhysRevB.61.13150. [DOI] [PubMed] [Google Scholar]
- 10.Pina-Salazar E.Z., Kaneko K. Adsorption of water vapor on mesoporosity-controlled singe wall carbon nanohorn. Colloids Interface Sci. Commun. 2015;5:8–11. doi: 10.1016/j.colcom.2015.05.002. [DOI] [Google Scholar]
- 11.Adelene Nisha J., Yudasaka M., Bandow S., Kokai F., Takahashi K., Iijima S. Adsorption and catalytic properties of single-wall carbon nanohorns. Chem. Phys. Lett. 2000;328:381–386. doi: 10.1016/S0009-2614(00)00956-8. [DOI] [Google Scholar]
- 12.Calbi M., Cole M., Gatica S., Bojan M., Johnson J.K. In: Adsorption by Carbons. Bottani E., Tascon J., editors. Elsevier Science; Amsterdam, The Netherlands: 2008. pp. 187–210. Chapter 9. [Google Scholar]
- 13.Migone A.D. In: Adsorption by Carbons. Bottani E., Tascon J., editors. Elsevier Science; Amsterdam, The Netherlands: 2008. pp. 403–430. Chapter 16. [Google Scholar]
- 14.Gatica S., Calbi M., Diehl R., Cole M. Review: Novel physics of gases near carbon nanotubes and buckyballs. J. Low Temp. Phys. 2008;152:89–107. doi: 10.1007/s10909-008-9812-8. [DOI] [Google Scholar]
- 15.Calbi M., Cole M., Gatica S., Bojan M., Stan G. Colloquium: Condensed phases of gases inside nanotube bundles. Rev. Mod. Phys. 2001;73 doi: 10.1103/RevModPhys.73.857. [DOI] [Google Scholar]
- 16.Rols S., Johnson M., Zeppenfeld P., Bienfait M., Vilches O., Schneble J. Argon adsorption in open-ended single-wall carbon nanotubes. Phys. Rev. B. 2005;71:155411. doi: 10.1103/PhysRevB.71.155411. [DOI] [Google Scholar]
- 17.Stan G., Bojan M., Curtarolo S., Gatica S., Cole M. Uptake of gases in bundles of carbon nanotubes. Phys. Rev. B. 2000;62:2173–2180. doi: 10.1103/PhysRevB.62.2173. [DOI] [Google Scholar]
- 18.Gatica S., Bojan M., Stan G., Cole M.J. Quasi-one- and two-dimensional transitions of gases adsorbed on nanotube bundles. Chem. Phys. 2001;114:3765–3769. doi: 10.1063/1.1339886. [DOI] [Google Scholar]
- 19.Krungleviciute V., Ziegler C.A., Banjara S.R., Yudasaka M., Iijima S., Migone A.D. Neon and CO2 adsorption on open carbon nanohorns. Langmuir. 2013;29:9388–9397. doi: 10.1021/la401033u. [DOI] [PubMed] [Google Scholar]
- 20.Calvillo A., Russell B., Migone A., Iijima S., Yudasaka M. Argon Adsorption on Open Carbon Nanohorns; Proceedings of APS March Meeting Abstracts; San Antonio, TX, USA. 2–6 March 2015; abstract Y16.002. [Google Scholar]
- 21.Krungleviciute V., Migone A.D., Yudasaka M., Iijima S. CO2 Adsorption on Dahlia-Like Carbon Nanohorns: Isosteric Heat and Surface Area Measurements. J. Phys. Chem. C. 2012;116:306–310. doi: 10.1021/jp208766u. [DOI] [Google Scholar]
- 22.Bansal R.C., Goyal M. Activated Carbon Adsorption. CRC Press; Boca Raton, FL, USA: 2005. [Google Scholar]
- 23.Yang R.T. Gas Separation by Adsorption Processes. Butterworths Publishers; Stoneham, MA, USA: 1987. [Google Scholar]
- 24.Maiga S.M. Ph.D. Thesis. Howard University; Washington, DC, USA: 2016. Adsorption of Gases on Graphene and Metal Organic Frameworks. [Google Scholar]
- 25.Myers A.L., Prausnitz J.M. Thermodynamics of mixed-gas adsorption. AIChE J. 1965;11:121–127. doi: 10.1002/aic.690110125. [DOI] [Google Scholar]
- 26.Babarao R., Hu Z., Jiang J., Chempath S., Sandler S.I. Storage and separation of CO2 and CH4 in silicalite, C168 schwarzite, and IRMOF-1: A comparative study from Monte Carlo simulation. Langmuir. 2007;23:659–666. doi: 10.1021/la062289p. [DOI] [PubMed] [Google Scholar]
- 27.Iijima S., Yudasaka M., Yamada R., Bandow S., Suenaga K., Kokai F., Takahashi K. Nano-aggregates of single-walled graphitic carbon nano-horns. Chem. Phys. Lett. 1999;309:165–170. doi: 10.1016/S0009-2614(99)00642-9. [DOI] [Google Scholar]
- 28.Frenkel D., Smit B. Understanding Molecular Simulation. Academic Press Inc.; Orlando, FL, USA: 2001. [Google Scholar]
- 29.Harris J.G., Yung K.H.J. Carbon Dioxide’s Liquid-Vapor Coexistence Curve And Critical Properties as Predicted by a Simple Molecular Model. Phys. Chem. 1995;99:12021–12024. doi: 10.1021/j100031a034. [DOI] [Google Scholar]
- 30.Jiang J.W., Sandler S.I.J. Separation of CO2 and N2 by Adsorption in C128 Schwarzite: A Combination of Quantum Mechanics and Molecular Simulation Study. J. Am. Chem. Soc. 2005;127:11989–11997. doi: 10.1021/ja0424575. [DOI] [PubMed] [Google Scholar]
- 31.Bruch L., Cole M., Zaremba E. Physical Adsorption: Forces and Phenomena. Dover Publications; Mineola, NY, USA: 2007. [Google Scholar]
- 32.Berry R.S., Rice S.A., Ross J. Physicalchemistry. John Wiley; NewYork, NY, USA: 1980. [Google Scholar]
- 33.Watts R.O., McGee I.J. Liquid State Chemical Physics. Wiley; New York, NY, USA: 1976. [Google Scholar]
- 34.Maitland G.C., Rigby M., Smith G.C., Wakeham W.A. Intermolecular Forces: Their Origin and Determination. Clarendon; Oxford, UK: 1987. pp. 565–566. Tables A 3.1 and A 3.2. [Google Scholar]


