

Abstract
A novel model is presented to study red blood cell (RBC) hemolysis at cellular level. Under high shear rates, pores form on RBC membranes through which hemoglobin (Hb) leaks out and increases free Hb content of plasma leading to hemolysis. By coupling lattice Boltzmann and spring connected network models through immersed boundary method, we estimate hemolysis of a single RBC under various shear rates. First, we use adaptive meshing to find local strain distribution and critical sites on RBC membranes, and then we apply underlying molecular dynamics simulations to evaluate damage. Our approach comprises three sub-models: defining criteria of pore formation, calculating pore size, and measuring Hb diffusive flux out of pores. Our damage model uses information of different scales to predict cellular level hemolysis. Results are compared with experimental studies and other models in literature. The developed cellular damage model can be used as a predictive tool for hydrodynamic and hematologic design optimization of blood-wetting medical devices.
Keywords: Flow-induced hemolysis, Cellular model, Red blood cell, Damage evaluation, Shear stress, Hemoglobin release
In various medical devices, such as hemodialysis machines, artificial hearts (1), prosthetic heart valves (2), and ventricular assist devices (VADs), mechanical stresses can be up to two orders of magnitude higher than its physiologically relevant range (3,4). Prolonged contact and collision between blood cells and device surfaces and regions of high shear stress leads to cell damage (5,6). When a cell is damaged, hemoglobin (Hb) is released into plasma which in severe cases may lead to renal failure, anemia, arrhythmias, and death (7–9). In milder cases, Hb is released through temporary pores on the red blood cell (RBC) membranes, which may lead to other pathologies. RBC damage induced by VADs over a long period of time is still one of the issues to be addressed (10). Moreover, acute hemolysis is an unavoidable side effect of extracorporeal circulation in regular 4-hour, three times per week dialysis.
In experimental studies, RBC damage is typically assessed through the amount of plasma-free Hb (pfHb) measured by flowing blood in microcirculation loops of the perfused artificial device. Giersiepen et al. (11) estimated shear-related blood damage in 25 heart valve prostheses. Zhang et al. (12) used novel coquette-type blood-shearing devices to study hemolysis. Fitting experiment data, empirical correlations were proposed to estimate hemolysis as a function of shear stress and exposure time. Due to the complex geometries and flow conditions of various devices, as well as the macroscopic nature of free Hb measurement, parameters obtained from these tests are only applicable to that specific device. Also, they cannot provide sufficient insight into flow-induced damage at cellular scale.
Bludszuweit (13), Yeleswarapu et al. (14), and Okamoto et al. (15) developed a hemolysis model for VADs where Hb release is correlated with shear rates and the exposure time that cells are subjected to. The stress history of RBCs along their streaklines was obtained by Lagrangian particle tracking. With integrative computation, cumulative RBC damage was measured. Instead of using a simple shear stress scalar, Arora et al. (16,17) incorporated a more complicated formulation for shear using a tensorial strain model to predict hemolysis based on RBC deformation. These computational fluid dynamics-based models rely on macroscale experimental estimation of damage in specific devices and lack a general blood cell damage evaluation criterion, where cellular level information is required.
Empirical correlations are widely used for the estimation of flow-induced hemolysis in blood-contacting medical devices. Most of them use power law to correlate shear stress, exposure time, and index of hemolysis In Giersiepen et al.’s study (11), A, α, and β are estimated as 3.62×10⁻⁵, 2.416, and 0.785, respectively whereas in the recent study of Zhang et al. (12), A= 1.228×10⁻⁵, α=1.9918, and β = 0.6606 are suggested. Zhang et al.’s formula (12) predicts 0.1% hemolysis for the exposure time of 887 ms under a shear rate of 30,000 s−1, while Giersiepen et al.’s formula (11) estimates 1% hemolysis under the same flow condition. One order of magnitude difference between these experimental works suggests that empirical estimations strongly depend on test device and experimental condition.
There are continuum cellular damage models based on the strain energy density (18–20). However, those models do not consider the physics of pore formations and Hb release. A more comprehensive multiscale model of sublytic damage is proposed by Vitale et al. (21) where they assume the nucleation of pores is dictated by the membrane energy landscape of the perturbation. Assuming pores relieve the tension and minimize the total free energy, they derived analytical expression for pore radius and density under shear rates ranging from 4000 to 42,000 s−1. Their descriptions of pore radius and density are a function of membrane areal strain varying from 0.16 to 6%. Other researchers have performed molecular dynamics (MD) simulations (22) of pore structure in the bilayers (23) as well as membrane disruption and rupture using dissipative particle dynamics (24) and Monte Carlo simulation (25). Cytoskeletal dynamics of human erythrocyte are specifically studied by Li et al. (26) where they used coarse-grained simulation to elucidate the roles of shear stress, specific chemical agents, and thermal fluctuations in cytoskeleton remodeling. To the best of our knowledge, there is no existing model yet which links cellular level damage to Hb release. Table 1 summarizes some literature works on RBC damage evaluation.
TABLE 1.
Summary of some cell damage researches reported in literatures
| Ref. | Approach/tool | Findings/target device | Year |
|---|---|---|---|
| Giersiepen et al. (11) | Experimental estimation | In vitro comparison of 25 prosthetic heart valves |
1990 |
| Yeleswarapu et al. (14) | Mathematical stress-based model | Included loading history and damage accumulation in rotatory blood pump |
1995 |
| Arora et al. (16,17) | Strain-based hemolysis model— ellipsoidal droplet—computational fluid dynamics |
2004 | |
| Chen (19) | Experiments τ = 5000 dyn/cm2—digital camera–ellipsoidal assumption |
Captured images of deformed cells. Calibrated simple mathematical model—simple channel |
2010 |
| Zhang et al. (12) | Experimental estimation | Novel couette-type blood-shearing devices |
2011 |
| Vitale et al. (21) | Multiscale strain-based model | Included hemoglobin transport dynamic | 2014 |
| Ezzeldin et al. (20) | 3D strain-based/coarse-grained RBC model | Included complex shape distortions of RBCs and damage in prosthetic heart valves |
2015 |
Cell damage occurs at different scales from nanoscale membrane pore initialization to microscale cell membrane rupture. In order to evaluate blood cell damage, the molecular level information of pore formation on the membrane needs to be linked with the cellular scale cell deformation and macroscopic flow condition. The goal of this article is to establish computational techniques to predict the blood cell dynamics and cellular damage under complex flow conditions. Spring connected model (27–29) of erythrocyte membrane is coupled with lattice Boltzmann (28) through immersed boundary (IB) method (30–34) in order to calculate local strain/stress of RBC membranes and study hemolysis as Hb molecules leak out of the damaged regions. Our damage model comprises three sub-models where we identify criteria for nanopore formation, determine pore dimensions, and finally calculate Hb diffusion out of porated regions as shown in Fig. 1. Unlike previous continuum approaches, we study cellular hemolysis by obtaining model parameters from underlying MD simulations. In the following sections, we will first describe and validate our model by stretch and shear tests, then evaluate shear-induced damage in a single RBC. The formulations and complete description of our fluid–cell interaction model is explained in the Appendix.
FIG. 1.
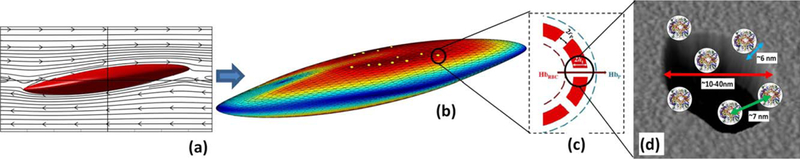
The summary of multiscale cell damage model: (a) RBC deformation under shear flow; (b) local strain distribution and nanopore formation; (c) Hb diffusion out of porated regions; and (d) schematic of Hb molecules diffuse out of membrane pore. [Color figure can be viewed at wileyonlinelibrary.com]
RBC DYNAMICS AND RUPTURE
Benchmark with optical tweezer experimental results
Following the optical tweezer experiment performed by Mills et al. (35), the deformation of RBC undergoing a dynamic load of 0–200 pN is characterized in order to validate our erythrocyte model. A total of 5120 triangular elements are used to mesh RBC membrane. The bending stiffness, local area constraint, global area constraint, and volume constraint constants are chosen as 2.77×10⁻¹⁸, 23.1×10⁻⁵, 4.72×10⁻⁶, and 249 kg m2/s2, respectively. The POW (repulsive power function potentials) force coefficient and the persistence length for 27 344 spectrin elements are chosen as 1.66×10⁻²⁷ N m2 and 14.68 nm, which are scaled for 5120 mesh elements in our case (27). To eliminate any residue membrane stress at equilibrium state, nodes were allowed to move on the RBC biconcave surface to minimize inplane energy before starting the simulation. In this stress-free condition, the membrane is relaxed, and equilibrium lengths of springs are recalculated. More detailed information about the spring network model can be found in (27). The stretching test is performed when pair forces are applied at 2% of mesh nodes at either sides of a RBC. Our results for axial and transverse diameters of the deformed RBC are well within the experimental error of Mills et al. (35) as shown in Fig. 2a. It also agrees well with studies by Fedosov and Caswell (36) and Pivkin and Karniadakis (37).
FIG. 2.
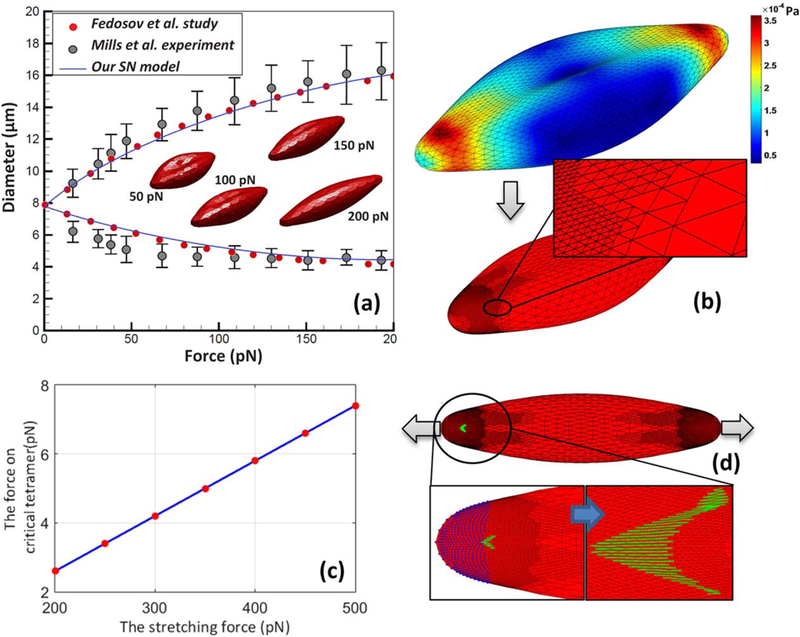
(a) The axial and transverse diameters of RBC deformed under stretching test; (b) stress distribution and adaptive spectrin level mesh generated locally in critical regions; (c) force on critical tetramer as RBC is stretched with various pulling forces; and (d) RBC rupture under high stretching forces. [Color figure can be viewed at wileyonlinelibrary.com]
Spectrin network is the main load bearing component of membrane. Therefore, spring forces are the dominant terms in calculating stress components compared to bilayer hydrostatic elastic force. Using Eq. 10 in the Appendix, stress distribution on erythrocyte membrane is calculated and plotted out in Fig. 2b when RBC undergoes the stretching test. The regions close to the gripping ends are identified as critical regions with the highest stress level where the membrane is more likely to be damaged. Finer triangular mesh with the sizes comparable to the size of spectrin tetramer is needed for studying the damage initiation and growth in these regions. Thus, smaller mesh is generated locally by splitting every triangular element into four so that the size of mesh is similar to spectrin size, ~75 nm, as shown in Fig. 2c. Using this approach, mesh can be refined dynamically, and simulation can be performed with minimal computational costs compared to uniform spectrin mesh.
The maximum pulling force in the optical tweezer experiment is 200 pN where RBC can completely recover its biconcave shape when the loading is removed. It is observed that the stretching force on critical tetramer, the spring with highest force, changes linearly with pulling force as shown in Fig. 2c. According to the CGMD study of Li et al. (26), actin– spectrin association is breakable at 10.9% bond strain which corresponds to 24.9 pN force. In the same study, it is mentioned that the strength of dimer–dimer association is known to be much weaker than the actin– pectrin association, but this disassociation force is not explicitly reported. In high pulling forces, some spectrin network bonds close to gripping ends break first. Then, rupture initiates at the tip of the damaged region, which ultimately leads to the fragmentation of RBC membrane as shown in Fig. 2d.
RBC deformation under shear flow
At rest, RBCs aggregate into a coin stack shape structure called rouleaux (38). In shear flow with low-shear rate , rouleaux break and cells tumble while preserving their biconcave shape. As the fluid shear rate increases, the tumbling gradually reduces, and RBCs deform into ellipsoidal shape. Tank-treading motion occurs at ~1 s−1 where the RBC major axis aligns with the flow (39). In this regime, the membrane starts to rotate around the cytoplasm. In higher shear flows, erythrocyte membrane is dilated. It is believed that a RBC reaches its 6% global areal strain limit as the shear rate approaches 42,000 s−1. Below this critical shear rate, RBC can completely recover its biconcave shape when the loading is removed (40).
Abkarian et al. (41) experimentally demonstrated tumbling, tank treading, and intermittent behavior of suspending RBCs in a viscous solution of dextran. Following Pivkin and Karniadakis’s (37) work, deformation of RBC under pure shear flow is studied when floated in dextran. The viscosity of dextran and intracellular fluid are assumed 22cP and 6cp, respectively. The oscillation period in low shear rates is plotted out in Fig. 3a where a good agreement with Abkarian et al.’s (41) experimental study is achieved. The flow fields surrounding tumbling and tank treading RBC are also demonstrated in Fig. 3a. The transition from tumbling to tank-treading motion is observed at ~ 1–1.5/s shear rates. We have also calculated tank-treading frequency of RBC under high shear rates ranging from 4000 to 42,000 s−1. Our results indicated that the oscillation period is inversely correlated with the shear rate as suggested in Fischer’s experimental study (42). Fitting our simulation data, we could link the oscillation period to the shear rate by following formula, .
FIG. 3.
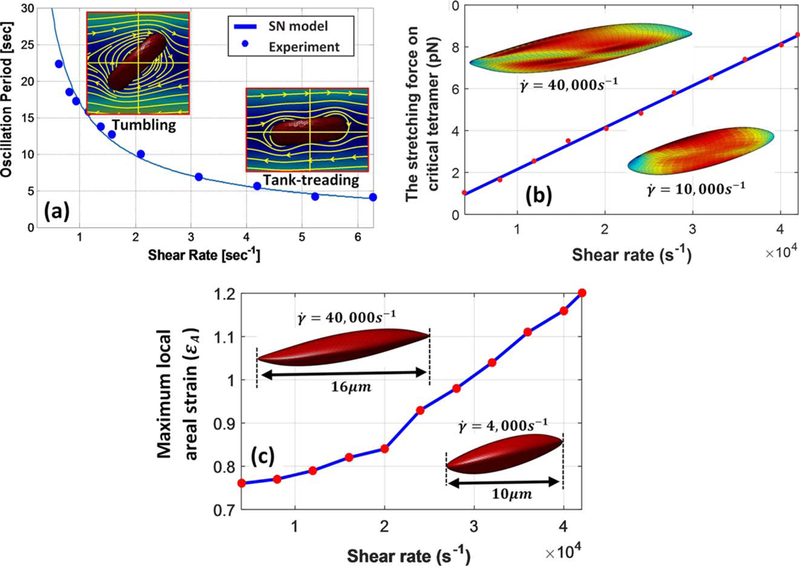
(a) Oscillation period over different shear rate for a RBC in shear flow, comparison of our model and experiment. (b) Maximum force on critical tetramer under various shear rates. (c) Maximum local areal stain on RBC membrane versus shear rate. [Color figure can be viewed at wileyonlinelibrary.com]
The membrane continuously undergoes cyclic stretch loading during RBC tank-treading motion. Moreover, stress/strain distributions on membrane also change during oscillation period because of RBC’s at-rest biconcave shape. In other words, tetramers in spectrin network may experience different stretch loading depending on where they are originally located on membrane. It is shown in Fig. 3b that the maximum force on critical tetramer almost linearly increases with shear rate and reaches ~8.3 pN in 42,000 s−1. At the critical shear rate of 42,000 s−1, the membrane stress level is significantly increased, and the RBC is stretched to twice its original diameter as shown in Fig. 3b,c. In shear rates above this threshold, irreversible damage to spectrin network and fragmentation of RBCs leads to significant increase in free Hb content of the suspending medium (43).
Formation of pores in regions with critically high areal strain during sublytic hemolysis allows limited release of Hb molecules. It should be noted that the maximum local areal strain of membrane varies from 75 to 120% under shear rates of 4000–42,000 s−1 as shown in Fig. 3b. Koshiyama and Wada (23) showed that nanopores begin to form on lipid bilayer membrane at 85% areal strain. Moreover, another MD study by Tomasini et al. (44) showed that in quasistatic (QS) shearing tests of lipid membrane, pores begin to form at ɛA=80%. Thus, our findings agree with these CGMD studies since sublytic hemolysis also starts at 4,000 s−1 with a maximum areal strain of 75%. In the following section, the sub-models for evaluating sublytic damage will be discussed.
MULTISCALE DAMAGE MODEL
The onset of pore formation initiates the release of intracellular content into plasma. The membrane dilates to 6% of its original size under 42,000 s−1 shear flow while local areal strain at critical sites can even reach 120% under the same flow condition. To the best of our knowledge, all previous strain-based hemolysis studies are based on global areal strain (14,16,17,21). However, it is necessary to study sublytic damage locally due to complex loading dynamics of erythrocyte membrane under shear. Our sublytic damage model is based on hindered Hb release out of pores formed in critical regions. It is indicated that below 42,000 s−1 shear rate, spectrin network is less likely to be damaged irreversibly. Thus, it is hypothesized that pores do not grow bigger than spectrin length, ~75 nm, during sublytic damage. Additionally, these nanopores are assumed to form instantly due to the relatively small time scale of pore growth (≈ 10 µs) (45) compared to the oscillation period of RBC (≈1–6 ms).
Pore formation in critical regions
Pore formation at the molecular level is a statistical phenomenon (23). Thus, the probability of pore formation in critical regions needs to be implemented into our damage model. Many researchers have performed MD simulations of pore structure in the bilayers (44,46–48). Koshiyama and Wada (23) specifically studied pore formation dynamics under various stretching speeds. They performed equibiaxial stretching simulations on a 40 nm × 40 nm bilayer patch with the pulling speeds, c, of 0.1, 0.3, and 1.0 m/s. Their MD simulation results indicated that multipores are more likely to form under high stretching speeds. They also performed QS stretching test where just a single pore was created (23). It has been described before that the oscillation period of RBC varies from 15 to 1.5 ms under 4000 and 42,000 s−1 shear rates. To calculate the membrane stretching speed under high shear rate flows, the RBC surface is hypothetically divided into 40 nm × 40 nm patches where they continuously undergo cyclic loading with the oscillation period of 1.5 ms. Assuming maximum 120% areal expansion, the pulling speed in critical patches can be estimated as 10 mm/s; which is much lower than c = 0.1 m/s in Koshiyama and Wada (23) study. Thus, it can be concluded that the membrane stretch can be considered as QS in extreme cases of sublytic hemolysis.
To present the average chance of pore formation as a function of areal strain, Koshiyama and Wada (23) used an error function to demonstrate the ratio of patches containing pores to total number of patches. It can be expressed as , where and σ are the mean and variance of critical areal strain, respectively. Their results for QS stretching case are fitted by Gaussian distribution function with the mean and variance of 1.04 and 0.07 and are used to calculate the probability of pore formation in this study as shown in Fig. 4a.
FIG. 4.
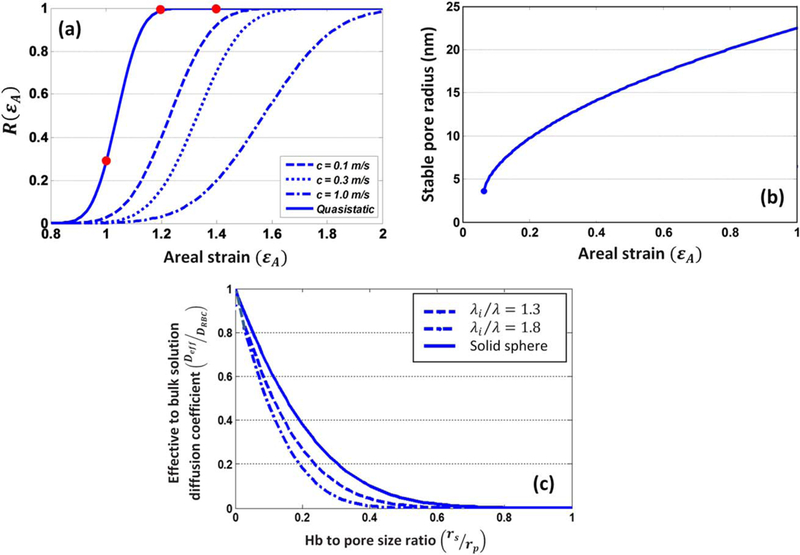
(a) The probability of pore formation R(ɛA) and its corresponding normal distribution for various stretching speeds (23); (b) the stable pore radius under various areal strain for 40 nm × 40 nm (46) patches; and (c) the effective diffusion to bulk solution diffusion coefficient over different Hb-to-pore size ratio.
Hb transport through nanopores
The so-called sublytic phase of RBC damage occurs when pores are large enough to allow Hb to escape. The Hb flux out of a single pore can be calculated as (21)
| (1) |
where HbRBC and Hbp are the intracellular and plasma Hb concentrations, respectively; Vp is the volume of plasma; Deff is the effective diffusion coefficient of Hb out of nanopores; and Apore is the pore opening area. Vp, HbRBC, and index of hemolysis (IH) are expressed as
| (2) |
where HbB and Hct are the blood Hb concentration and hematocrit, respectively. Using Eq. (1), Eq. (2) can be rewritten as
| (3) |
Assuming zero initial pfHb concentration , IH level can be calculated using effective diffusion, pore opening area, and membrane thickness. These parameters depend on local loading condition of bilayer membrane. In what follows, these parameters are discussed in detail.
Pore size and length
One important part of our damage model is estimating the membrane thickness and pore size as a function of areal strain. Tolpekina et al. (46) used coarse grained MD to stretch a bilayer patch up to 1.7 of its equilibrium area. They established the phase diagram of pores and identified regions where pores are stable. Based on these findings, they also proposed a simple theoretical model to correlate pore radius, Rpore, and area strain by minimizing free energy. It is expressed as
| (4) |
where A0 is the area of the tensionless membrane without a pore; KA=250 mJ/m2 is the compressibility modulus of membrane; and kc is the line tension coefficient which is equal to 3.5×10⁻¹¹ J/m. The average pore radius in 40 nm × 40 nm patch as a function of relative areal stretch is demonstrated in Fig. 4b. Moreover, the membrane thickness decreases as membrane stretches. Koshiyama and Wada (23) also demonstrated how membrane thickness at porated regions changes by areal strain, which is directly implemented into our model.
Hb diffusion out of nanopores
Hb is the main component of the RBC. A RBC approximately contains 280 m Hb molecules with molecular size of 6 nm × 5 nm × 5 nm(49). Hb in erythrocytes is highly concentrated, 330 mg/mL under physiological conditions. It occupies a quarter of a cell volume where the average separation distance between its molecules is 6.9 nm. Due to Hb high concentration inside RBC, its self-diffusion coefficient is six times smaller compared to that in dilute solution (50). An exponential function is proposed by Riveros-Moreno and Wittenberg (51) to demonstrate correlation between Hb concentration and diffusion coefficient. Significant reduction in Hb diffusivity is attributed to obstruction effects by excluded volume interactions. Doster and Longeville (50) experimentally estimated the self-diffusion coefficient of Hb in RBC as 1.75 × 10⁻⁷ cm2/s, while its diffusion coefficient in dilute solution is reported as 8.61×10⁻⁷ cm2/s.
During sublytic hemolysis, Hb diffuses out of temporary small nanopores. The effective diffusion coefficient of these macromolecules through pores of comparable size is usually much lower than their value in bulk solution. Hb transverse diffusion, known as “hindered” or “restricted” diffusion, is caused in two ways. First, steric and long-range interactions between Hb and pore wall in lipid bilayer tend to exclude Hb from some radial positions within the pores. Second, hydrodynamic drag on Hb molecule is increased due to confined space of the pore (52,53). The effective diffusion coefficient of these macromolecules can be expressed in terms of the solute-to-pore size ratio as , where K−1 ratio of the friction coefficient of the solute in bulk solution to that within the pore (54) and Փ is the ratio of the average solute concentration within the pore to that in bulk solution. Hb molecules inside RBC are partially flexible and exhibit hydrodynamic behavior similar to coiled chain molecules. The partition coefficient, Փ, of a neutral, randomly coiled macromolecule can be calculated by the analytical expression of Casassa (55). K−1 and Փ are written as
| (5) |
| (6) |
where di are the roots of J0(d)=0, with J0 representing the Bessel function of the first kind, of order zero. λi depends on the permeability parameter, which demonstrates the resistance to solvent flow through the macromolecule and can be estimated as . In the current study, is assumed as 1.8. Furthermore, the classical equation of Stokes–Einstein, , is used to calculate Hb Stokes-Einstein radius where k is Boltzmann’s constant, T is the absolute temperature, and η is the solvent viscosity. Finally, using equations above, effective diffusion of Hb through nanopores can be estimated in terms of solute-to-pore size ratio as shown in Fig. 4c.
HEMOLYSIS RESULT
To incorporate the statistical feature of pore formation into our model, erythrocyte membrane is divided into 40 nm × 40 nm patches. A critical areal strain threshold, randomly picked from Gaussian distribution as shown in Fig. 4a, is assigned to each patch. As RBC membrane deforms under shear flow, each patch experiences different loading cycle during oscillation periods. Once areal strain exceeds the specified critical threshold, a single pore will form in the damaged patches. The pore size and length can be calculated using areal strain as described before. It should be noted that the areal strain and accordingly pore size and effective diffusion also change during oscillation period. Finally, the pores in damaged patches will be assumed closed as areal strain reaches below 20% when pore size is smaller than the Hb molecule. The solution procedure is illustrated in the flow chart shown in Fig. 5.
FIG. 5.
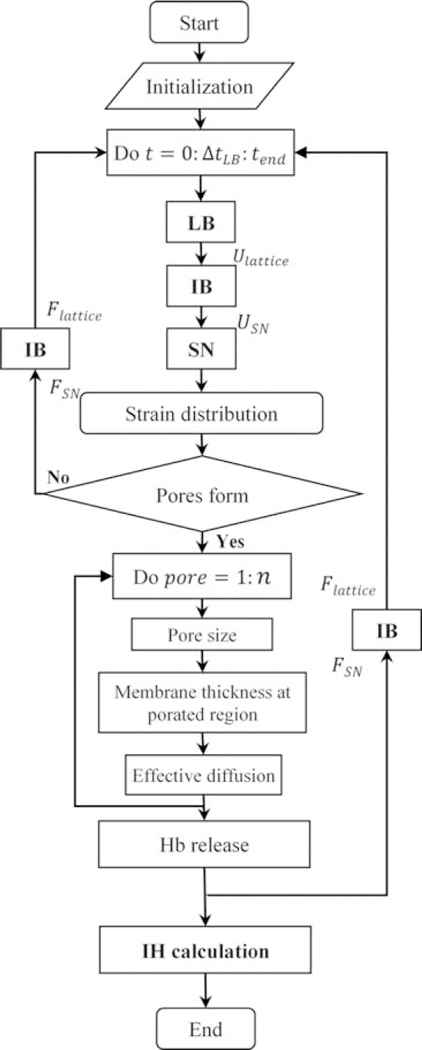
Solution process flow chart.
Due to the biconcave shape of RBC, the porated area, shown in Fig. 6a, also fluctuates during oscillation period. The relative pore area changing with oscillation time is plotted out under various shear rates in Fig. 6b. The average relative pore area over oscillation period varies between 0.001 and 0.03 under shear rates ranging from 14,000 to 42,000 s−1. Minimizing membrane energy landscape, Vitale et al. (21) also estimated ~5.5% relative pore area under a critical shear rate of 42 000/s when the global areal strain is 6%. Although our approach is completely different from their continuum-based method, our relative pore area matches with their prediction. In the same study, pore density and diameter in 6% global areal strain are reported as 111/µm2 and 24 nm, respectively. It is worth mentioning that pore size in our damage model varies between ~10 and 40 nm.
FIG. 6.
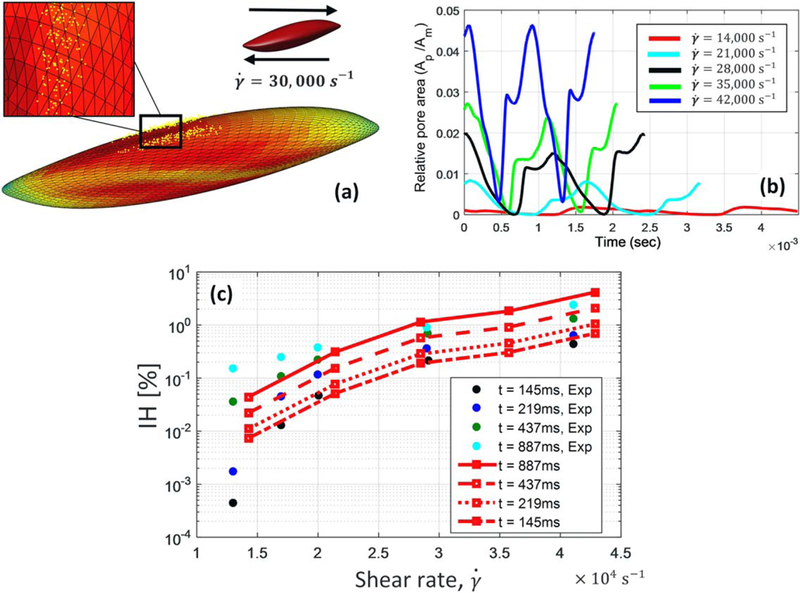
(a) Nanopore distribution under RBC membrane under 30,000 s−1 shear flow; (b) relative pore area fluctuation during oscillation time in different shear rates; and (c) comparison of the index of hemolysis (IH) between Giersiepen’s experimental data (points) (11) and our damage evaluation (lines). [Color figure can be viewed at wileyonlinelibrary.com]
Diffusion of Hb out of nanopores during sublytic damage is hindered by excluded volume interac-tions. Vitale et al. (21) used hemolysis data from Heuser and Opitz’s (56) experiments to propose an exponential function for mass-transport coefficient of Hb across erythrocyte membrane as a function of shear rate. It was expressed as , where Gf and L are the shear rate and membrane thickness, respectively. They estimated the mass-transport coefficient as ~0.01 and 0.2 µm/s under shear rates of 4000 and 42,000 s−1, respectively. On the contrary to Vitale et al.’s (21) study, we calculated Hb mass-transport coefficient individually for each pore since effective diffusion coefficient and accordingly Kc are functions of pore size. Averaging Hb mass-transport coefficient over all pores, it is observed that our damage model predicts that Kc varies from 0.04 to 0.55 µm.s−1, which roughly agrees with their experimentally estimated range. So far, we presented validation of our sub-models by comparing our results for mass transport coefficient and relative pore area with other studies.
Calculating strain distribution on RBC membrane in every time step, we can accordingly find the location of pores, membrane thickness, pores diameter and effective diffusion as shown in Fig. 5. Subsequently, Hb flux out of each nanopore is estimated separately using ODE in Eq. (3). Finally, we would be able to calculate index of hemolysis during various exposure times. It is shown in Fig. 6c that our results agree well with the experimental study of Giersiepen et al. (11) under shear rates higher than 20,000 s−1. Minor inconsistencies between our prediction and experimental measurement may be attributed to simplified assumptions in our sub-models. For instance, CGMD results from equibiaxial stretching tests are used to determine pore formation criteria while the membrane undergoes various loading conditions which are not necessarily equibiaxial; nanopores may not be always circular as it happens in equibiaxial stretching condition; Hb–lipid bilayer interaction is overlooked for calculation of Hb hindered diffusion coefficient. Moreover, our damage model focuses on Hb diffusion out of a single RBC compared to macroscale estimation of hemolysis in experimental setups.
To better understand different model parameters such as Hb diffusive transport and relative pore area, hemolysis for low IH levels, Eq. (3), can be roughly estimated as
| (7) |
where ARBC=135 µm2 and VRBC=95 µm3 are the initial area and volume of a RBC, respectively; X is the relative pore area; and Δt is the exposure time. Giersiepen hemolysis experiments (11) showed that IH level increase to 1% during Δt = 887 ms exposure time under 30,000 s−1 shear rate. Assuming the average relative pore area of X = 1% under this flow condition (Fig. 6b), Kc can be roughly estimated as 0.43 µm/s using Eq. (7). On the other hand, Kc can be calculated as using normal diffusion coefficient of Hb in dilute solution. This considerable difference is attributed to small size of pores, comparable to size of Hb molecules, which highly restricts diffusion of Hb out of nanopores. Therefore, it seems reasonable to assume that spectrin network confines the growth of pores on lipid bilayer during sublytic damage.
CONCLUSION
We have developed a cellular damage model which can directly correlate the microscale state of the cell membrane to local stress/strain distribution and correspondingly hemoglobin release. Spring connected model of erythrocyte membrane is coupled with lattice Boltzmann through immersed boundary method to simulate deformation of red blood cells. RBC stretching and shearing tests are performed to validate our cell model. The dynamics of cell rupture are studied when spectrin network is damaged under high stretching forces. Moreover, the local conditions, which lead to initiation of pore formation and sublytic damage of RBC, are also studied. It is found that pores continuously appear/disappear as RBC tank-treads under high shear flows. After identifying the size and location of these nanopores, Hb flux is measured to calculate index of hemolysis in term of exposure time. Finally, it is shown that hemolysis predicted from our cellular model results agrees well with experimental studies.
Unlike previous approaches, we studied hemolysis locally by obtaining model parameters from underlying molecular dynamics simulations. Our method can be significantly improved by studying each sub-model separately in more depth. For instance, hindered diffusion coefficient of Hb molecules out of small pores in lipid bilayer can be accurately estimated by CGMD simulations. Furthermore, it should be mentioned that our approach can only handle mechanical damages. The damages to RBC membranes by chemical changes such as iron deficiency which influences lifespan of RBCs in circumstance like acidemia and oxidative stress (57) are not considered in this paper but can be implemented as input to our model in the future. For instance, we can input chemical damages by modifying bending stiffness and area constraint constants of RBC membranes. In this situation, by altering the physical property of the RBCs, one can observe that the characteristics of RBC itself may affect hemolysis. In addition to these limitations, it should be mentioned that our damage model focuses on Hb diffusion out of a single RBC compared to macroscale estimation of hemolysis in typical experimental setups. RBCs in actual biomedical devices take different pathways and undergo various stress history. Because of high computational costs of our numerical model, we are limited to use a statistical sampling approach to evaluate damage in a large computational domain. Therefore, we can only apply our model to a handful of sample RBCs in the flow to assess damage in an actual biomedical device.
As noted before, experimental evaluation of damage strongly depends on test device and experiment condition. Thus, we have linked cellular level damage to Hb release to address this issue. Using this method, we are able to develop general criteria independent of particular device. Overall, our novel cellular approach can be used as a predictive tool to microscopically evaluate flow induced damage in any general device.
Acknowledgments:
The authors acknowledge the support of this work from National Science Foundation CAREER grant CBET-0955214, CBET-1264808, and DMS-1516236 as well as National Institutes of Health grant EB015105, and Alternatives Research & Development Foundation.
REFERENCES
- 1.Throckmorton AL, Kapadia JY, Chopski SG, et al. Numerical, hydraulic, and hemolytic evaluation of an intravascular axial flow blood pump to mechanically support Fontan patients. Ann Biomed Eng 2011;39:324–36. [DOI] [PubMed] [Google Scholar]
- 2.Castellini P, Pinotti M, Scalise L. Particle image velocime try for flow analysis in longitudinal planes across a mechanical artificial heart valve. Artif Organs 2004;28:507–13. [DOI] [PubMed] [Google Scholar]
- 3.Ku DN. Blood flow in arteries. Annu Rev Fluid Mech 1997; 29:399–434. [Google Scholar]
- 4.Tillmann W, Reul H, Herold M, Bruss K-H, Van Gilse J. In-vitro wall shear measurements at aortic valve prostheses. J Biomech 1984;17:263–79. [DOI] [PubMed] [Google Scholar]
- 5.Kormos R, Borovetz H, Griffith B, et al. Rheologic abnormalities in patients with the Jarvik-7 total artificial heart. ASAIO J 1987;33:413–7. [PubMed] [Google Scholar]
- 6.Hung TC, Butter DB, Yie C, et al. Effects of long term Novacor artificial heart support on blood rheology. ASAIO Trans Am Soc Artif Internal Organs 1990;37:M312–3. [PubMed] [Google Scholar]
- 7.Vural KM. Ventricular assist device applications. Anatol J Cardiol 2008;8:117–30. [PubMed] [Google Scholar]
- 8.McCarthy PM. HeartMate implantable left ventricular assist device—bridge to transplantation and future applications. Ann Thorac Surg 1995;59:S46–51. [DOI] [PubMed] [Google Scholar]
- 9.AlJarallah AS, Duncan WJ, Broecker L, Allen L, Cornel The Hemopump as a left ventricular assist device in pediatric applications: initial Canadian applications. Can J Cardiol 1997;13:489–94. [PubMed] [Google Scholar]
- 10.Polaschegg HD. Red blood cell damage from extracorporeal circulation in hemodialysis. Semin Dial 2009;22:524–31. [DOI] [PubMed] [Google Scholar]
- 11.Giersiepen M, Wurzinger L, Opitz R, Reul H. Estimation of shear stress related blood damage in heart valve prostheses in vitro comparison of 25 aortic valves. Int J Artif Organs 1990;13:300–6. [PubMed] [Google Scholar]
- 12.Zhang T, Taskin ME, Fang HB, et al. Study of flow induced hemolysis using novel coquette type blood shearing devices. Artif Organs 2011;35:1180–6. [DOI] [PubMed] [Google Scholar]
- 13.Bludszuweit C Model for a general mechanical blood damage prediction. Artif Organs 1995;19:583–9. [DOI] [PubMed] [Google Scholar]
- 14.Yeleswarapu KK, Antaki JF, Kameneva MV, Rajagopal KR. A mathematical model for shear induced hemolysis. Artif Organs 1995;19:576–82. [DOI] [PubMed] [Google Scholar]
- 15.Okamoto E, Hashimoto T, Inoue T, Mitamura Y. Blood compatible design of a pulsatile blood pump using computational fluid dynamics and computer aided design and manufacturing technology. Artif Organs 2003;27:61–7. [DOI] [PubMed] [Google Scholar]
- 16.Arora D, Behr M, Pasquali M. Blood damage measures for ventricular assist device modeling. Artif Organs 2004. [accepted for publication]. [DOI] [PubMed]
- 17.Arora D, Behr M, Pasquali M. A tensor based measure for estimating blood damage. Artif Organs 2004;28:1002–15. [DOI] [PubMed] [Google Scholar]
- 18.Yan KC, Nair K, Sun W. Three dimensional multiscale modelling and analysis of cell damage in cell encapsulated alginate constructs. J Biomech 2010;43:1031–8. [DOI] [PubMed] [Google Scholar]
- 19.Chen Y, Sharp MK. A strain based flow induced hemolysis prediction model calibrated by in vitro erythrocyte deformation measurements. Artif Organs 2011;35: 145–56. [DOI] [PubMed] [Google Scholar]
- 20.Ezzeldin HM, de Tullio MD, Vanella M, Solares SD, Balaras E. A strain based model for mechanical hemolysis based on a coarse grained red blood cell model. Ann Biomed Eng 2015;1–12. [DOI] [PubMed]
- 21.Vitale F, Nam J, Turchetti L, et al. A multiscale, biophysical model of flow induced red blood cell damage. AIChE J 2014;60:1509–16. [Google Scholar]
- 22.Zhou Y, Sohrabi S, Tan J, Liu Y. Mechanical properties of nanoworm assembled by DNA and nanoparticle conjugates. Nanosci Nanotechnol 2016;16:5447–56. [DOI] [PubMed] [Google Scholar]
- 23.Koshiyama K, Wada S. Molecular dynamics simulations of pore formation dynamics during the rupture process of a phospholipid bilayer caused by high speed equibiaxial stretching. J Biomech 2011;44:2053–8. [DOI] [PubMed] [Google Scholar]
- 24.Groot RD, Rabone KL. Mesoscopic simulation of cell membrane damage, morphology change and rupture by nonionic surfactants. Biophys J 2001;81:725–36. [DOI] [PMC free article] [PubMed] [Google Scholar]
- 25.Neder J, West B, Nielaba P, Schmid F. Coarse grained simulations of membranes under tension. J Chem Phys 2010; 132:115101. [DOI] [PubMed] [Google Scholar]
- 26.Li J, Lykotrafitis G, Dao M, Suresh S. Cytoskeletal dynamics of human erythrocyte. Proc Natl Acad Sci USA 2007; 104:4937–42. [DOI] [PMC free article] [PubMed] [Google Scholar]
- 27.Fedosov DA, Caswell B, Karniadakis GE. A multiscale red blood cell model with accurate mechanics, rheology, and dynamics. Biophys J 2010;98:2215–25. [DOI] [PMC free article] [PubMed] [Google Scholar]
- 28.Tan J, Keller W, Sohrabi S, Yang J, Liu Y. Characterization of nanoparticle dispersion in red blood cell suspension by the lattice Boltzmann-immersed boundary method. Nano materials 2016;6:30. [DOI] [PMC free article] [PubMed] [Google Scholar]
- 29.Liu Y, Liu WK. Rheology of red blood cell aggregation by computer simulation. J Comput Phys 2006;220:139–54. [Google Scholar]
- 30.Liu WK, Liu YL, Farrell D, et al. Immersed finite element method and its applications to biological systems. Comput Methods Appl Mech Eng 2006;195:1722–49. [DOI] [PMC free article] [PubMed] [Google Scholar]
- 31.Tan J, Thomas A, Liu Y. Influence of red blood cells on nanoparticle targeted delivery in microcirculation. Soft Matter 2012;8:1934–46. [DOI] [PMC free article] [PubMed] [Google Scholar]
- 32.Tan J, Shah S, Thomas A, Ou Yang HD, Liu Y. The inflence of size, shape and vessel geometry on nanoparticle distribution. Microfluid Nanofluid 2013;14:77–87. [DOI] [PMC free article] [PubMed] [Google Scholar]
- 33.Tan J, Wang S, Yang J, Liu Y. Coupled particulate and continuum model for nanoparticle targeted delivery. Comput Struct 2013;122:128–34. [DOI] [PMC free article] [PubMed] [Google Scholar]
- 34.Sohrabi S, Zheng J, Finol EA, Liu Y. Numerical simulation of particle transport and deposition in the pulmonary vasculature. J Biomech Eng 2014;136:121010. [DOI] [PMC free article] [PubMed] [Google Scholar]
- 35.Mills J, Qie L, Dao M, Lim C, Suresh S. Nonlinear elastic and viscoelastic deformation of the human red blood cell with optical tweezers. Mech Chem Biosyst 2004;1:169–80. [PubMed] [Google Scholar]
- 36.Fedosov DA, Caswell B, Karniadakis GE. Coarse grained red blood cell model with accurate mechanical properties, rheology and dynamics. Conf Proc IEEE Eng Med Biol Soc 2009;2009:4266–9. [DOI] [PubMed] [Google Scholar]
- 37.Pivkin IV, Karniadakis GE. Accurate coarse grained modeling of red blood cells. Phys Rev Lett 2008;101:118105. [DOI] [PubMed] [Google Scholar]
- 38.Schmid Schonbein€ H, Gaehtgens P, Hirsch H. On the shear rate dependence of red cell aggregation in vitro. J Clin Investig 1968;47:1447–54. [DOI] [PMC free article] [PubMed] [Google Scholar]
- 39.Down LA, Papavassiliou DV, Edgar A. Significance of extensional stresses to red blood cell lysis in a shearing flow. Ann Biomed Eng 2011;39:1632–42. [DOI] [PubMed] [Google Scholar]
- 40.Leverett L, Hellums J, Alfrey C, Lynch E. Red blood cell damage by shear stress. Biophys J 1972;12:257–73. [DOI] [PMC free article] [PubMed] [Google Scholar]
- 41.Abkarian M, Faivre M, Viallat A. Swinging of red blood cells under shear flow. Phys Rev Lett 2007;98:188302. [DOI] [PubMed] [Google Scholar]
- 42.Fischer TM. Tank tread frequency of the red cell membrane: dependence on the viscosity of the suspending medium. Biophys J 2007;93:2553–61. [DOI] [PMC free article] [PubMed] [Google Scholar]
- 43.Sutera S, Mehrjardi M. Deformation and fragmentation of human red blood cells in turbulent shear flow. Biophys J 1975;15:1–10. [DOI] [PMC free article] [PubMed] [Google Scholar]
- 44.Tomasini MD, Rinaldi C, Tomassone MS. Molecular dynamics simulations of rupture in lipid bilayers. Exp Biol Med 2010;235:181–8. [DOI] [PubMed] [Google Scholar]
- 45.Chang D, Reese TS. Changes in membrane structure induced by electroporation as revealed by rapid freezing electron microscopy. Biophys J 1990;58:1–12. [DOI] [PMC free article] [PubMed] [Google Scholar]
- 46.Tolpekina T, Den Otter W, Briels W. Simulations of stable pores in membranes: system size dependence and line tension. J Chem Phys 2004;121:8014–20. [DOI] [PubMed] [Google Scholar]
- 47.den Otter WK. Free energies of stable and metastable pores in lipid membranes under tension. J. Chem Phys 2009;131:205101. [DOI] [PubMed] [Google Scholar]
- 48.Leontiadou H, Mark AE, Marrink SJ. Molecular dynamics simulations of hydrophilic pores in lipid bilayers. Biophys J 2004;86:2156–64. [DOI] [PMC free article] [PubMed] [Google Scholar]
- 49.Erickson HP. Size and shape of protein molecules at the nanometer level determined by sedimentation, gel filtration, and electron microscopy. Biol Proced Online 2009; 11:32–51. [DOI] [PMC free article] [PubMed] [Google Scholar]
- 50.Doster W, Longeville S. Microscopic diffusion and hydrodynamic interactions of hemoglobin in red blood cells. Bio-phys J 2007;93:1360–8. [DOI] [PMC free article] [PubMed] [Google Scholar]
- 51.Riveros Moreno V, Wittenberg JB. The self diffusion coefficients of myoglobin and hemoglobin in concentrated solutions. J Biol Chem 1972;247:895–901. [PubMed] [Google Scholar]
- 52.Davidson MG, Deen MW. Hydrodynamic theory for the hindered transport of flexible macromolecules in porous membranes. J Membr Sci 1988;35:167–92. [Google Scholar]
- 53.Sohrabi S, Saidi MS, Saadatmand M, Banazadeh MH, Firoozabadi B. Three dimensional simulation of urine concentrating mechanism in a functional unit of rat outer medulla. I. Model structure and base case results. Math Bio sci 2014;258:44–56. [DOI] [PubMed] [Google Scholar]
- 54.Davidson MG, Deen WM. Hindered diffusion of water soluble macromolecules in membranes. Macromolecules 1988;21:3474–81. [Google Scholar]
- 55.Casassa EF. Equilibrium distribution of flexible polymer chains between a macroscopic solution phase and small voids. J Polym Sci B: Polym Lett 1967;5:773–8. [Google Scholar]
- 56.Heuser G, Opitz R. A couette viscometer for short time shearing of blood. Biorheology 1979;17:17–24. [DOI] [PubMed] [Google Scholar]
- 57.Handelman GJ, Levin NW. Red cell survival: relevance and mechanism involved. J Renal Nutr 2010;20:S84–8. [DOI] [PubMed] [Google Scholar]