

Abstract
Prolonged, disabling fatigue is the hallmark of chronic fatigue syndrome (CFS). Previous neuroimaging studies have provided evidence for nervous system involvement in CFS etiology, including perturbations in brain structure/function. In this arterial spin labeling (ASL) MRI study, we examined variability in cerebral blood flow (CBFV) and heart rate (HRV) in 28 women: 14 with CFS and 14 healthy controls. We hypothesized that CBFV would be reduced in individuals with CFS compared to healthy controls, and that increased CBFV and HRV would be associated with lower levels of fatigue in affected individuals. Our results provided support for these hypotheses. Although no group differences in CBFV or HRV were detected, greater CBFV and more HRV power were both associated with lower fatigue symptom severity in individuals with CFS. Exploratory statistical analyses suggested that protective effects of high CBFV were greatest in individuals with low HRV. We also found novel evidence of bidirectional association between the very high frequency (VHF) band of HRV and CBFV. Taken together, the results of this study suggest that CBFV and HRV are potentially important measures of adaptive capacity in chronic illnesses like CFS. Future studies should address these measures as potential therapeutic targets to improve outcomes and reduce symptom severity in individuals with CFS.
Keywords: Chronic fatigue, Brain imaging, Regional signal variability, Heart rate variability, Arterial spin labeling, Cerebral blood flow
Introduction
Prolonged, disabling fatigue is the hallmark of chronic fatigue syndrome (CFS). CFS is most commonly regarded as a post-infectious condition whereby an individual experiences a cluster of fatigue related symptoms for at least 6 months, including exercise intolerance, chronic pain, sleep problems, cognitive impairments, and autonomic symptoms (Fukuda et al. 1994). It is estimated that approximately 2.5 million individuals in the US have CFS, resulting in associated costs of $17–24 billion annually (Clayton 2015).
Research over the past few decades has described central and autonomic nervous system abnormalities associated with CFS, as well as immune system and metabolic changes in affected individuals (Komaroff and Cho 2011). Structural and functional neuroimaging studies have demonstrated several key findings within this population that provide evidence for central nervous system (CNS) involvement in ME/CSF. For example, compared to unaffected individuals, testing of patients with CFS has demonstrated evidence for microglial activation in brain regions associated with emotion and memory (Nakatomi et al. 2014), reduced levels of brain derived neurotrophic factor (Sorenson et al. 2014), and volumetric reductions in parietal and frontal brain regions (Puri et al. 2012; Shan et al. 2016; Okada et al. 2004). Using functional MRI, previous CFS studies have described reduced basal ganglia activation (Miller et al. 2014), reduced cortical blood flow (Yoshiuchi et al. 2006), and altered functional connectivity both at rest and during the performance of a cognitive task (Gay et al. 2016; Boissoneault et al. 2016; Boissoneault et al. 2018). Further, the results of a systematic review examining autonomic nervous system (ANS) studies in patients with CFS suggest that heart rate control is altered in this population, including increased prevalence of postural orthostatic tachycardia syndrome (Van Cauwenbergh et al. 2014). However, it is currently poorly understood how abnormal functional brain and cardiac responsiveness contribute to CFS symptoms.
Of particular interest for the present study is previous work about the important role of regional brain signal variability (RSV) in health and disease (Garrett et al. 2013), which examines tonic, ongoing brain functioning (Pinneo 1966), rather than phasic, stimulus-driven activity captured by traditional neuroimaging analyses (Garrett et al. 2013). Importantly, it has been suggested that existing tonic activity creates the scaffolding on which phasic activity can be modulated. As a result, greater RSV is likely protective and renders the brain more robust to perturbations, given that it lightens the load of any one specific network node (Basalyga and Salinas 2006; Faisal et al. 2008). Additionally, RSV also likely reflects moment-to-moment neural flexibility and adaptability, or dynamic range (Yang et al. 2012), further supporting the notion that increased variability equates to increased neural resilience. Behaviorally, lower RSV has been linked to clinical disease states (Takahashi 2013), poorer cognitive performance in healthy adults (Wutte et al. 2011), and increased responses to painful stimuli in healthy adults (Rogachov et al. 2016). In general, these studies demonstrate that greater RSV is associated with more optimal behavioral outcomes, such as better memory performance and reduced central pain sensitivity.
In addition to RSV, which could provide information about CNS adaptability in patients with CFS, heart rate signal variability (HRV) has also been proposed as a metric of resilience, i.e. greater variability is associated with better ANS functioning (Evans et al. 2013; Ferreira and Zanesco 2016). In this regard, a functioning ANS provides optimal cardiovascular system regulation through balanced sympathetic and parasympathetic neuronal input. Findings related to HRV abnormalities in CFS are equivocal, with some findings suggesting no significant difference with healthy controls, and other studies demonstrating aberrant functioning in this population (Van Cauwenbergh et al. 2014).
For the present study, we used arterial spin labeling (ASL) MRI to quantify RSV in individuals with CFS compared to healthy individuals to determine its relationship with self-reported fatigue and HRV. Whereas the more commonly used blood-oxygenation level dependent (BOLD) fMRI is mostly an indirect measure of metabolic brain activity, ASL allows for direct quantification of cerebral blood flow (CBF) (ml/100 g/min). Using ASL permitted us to characterize RSV as variance in CBF (i.e., CBFV) and its association with ANS/cardiovascular variability. We hypothesized that CFS patients would demonstrate lower CBFV and HRV than HC. Furthermore, we hypothesized that increased CBFV and HRV would be associated with lower levels of fatigue in individuals with CFS.
Methods
Participants
Thirty-four women were recruited for this study, including 17 individuals with CFS and 17 healthy controls (HC). CFS participants met Centers for Disease Control criteria for chronic fatigue syndrome (Fukuda et al. 1994) and were excluded from the study if they reported a history of any other condition confounding the CFS diagnosis including multiple sclerosis, congestive heart disease, hypothyroidism, inflammatory muscle disease, or significant psychiatric illness (e.g., major depression or psychosis). In addition, the subjects could not have been diagnosed with an auto-immune disease or diabetes. Chronic fatigue had to be present for at least 6 months. Similar exclusion criteria were applied to HC participants, with the exception that reports of fatigue lasting longer than 6 months or any chronic pain condition were exclusionary. Individuals screened for both groups were allowed to participate if they had well-controlled hypertension or hypothyroidism. Overall, 18% of CFS patients were on antihypertensives and 12% on thyroid replacement therapy. Similarly, 12% of HC took antihypertensives and 18% took thyroid replacements. All individuals with contraindications for MRI (including ferromagnetic implants, pregnancy, and claustrophobia) were excluded. Qualifying individuals were asked to get a full night’s sleep (≥ 6 h), refrain from drinking caffeinated beverages on the day of the imaging session, abstain from alcohol use or other psychoactive substances in the 24 h prior to the study, and discontinue any medications except anti-hypertensives, thyroid replacement medications, and/or vitamins 24 h prior to laboratory sessions. HRV and MRI data were collected during separate sessions within the same week.
Clinical and affective measures
During screening, participants reported perceived role and physical function ranging from “no impairment in function” to “no function at all” using visual analog scales (VAS; 0–100). They also completed the Pittsburgh Sleep Quality Index (PSQI), which measures sleep quality over the past month (Buysse et al. 1989). PSQI total scores ≤5 are associated with good sleep quality, whereas higher scores are related to poor sleep. Immediately prior to scanning, all participants rated their overall pain, depression, anxiety, and fatigue on a VAS (0–100). These VAS ranged from “no pain/depression/anxiety/fatigue at all” to “most intense pain/depression/anxiety/fatigue imaginable” (Price et al. 1994).
HRV analysis
Subjects were connected to an electrocardiogram (ECG) measuring system while resting supine [Lifecard system (Space Lab Healthcare, Snoqualmie, WA)] to record ECG signals over 15 min for subsequent analysis of HRV components. Throughout the quiet resting period, ECG signals were collected with the Lifecard CF recoding system via electrodes attached to the extremities and chest. Subsequently, the data were downloaded to a computer and analyzed. HRV indices were calculated using the Impresario software (Space Lab Healthcare, Snoqualmie, WA). The ECG was manually reviewed for any misclassifications or errors. Identified erroneous R–R intervals were either replaced with values obtained by cubic spline interpolation or deleted depending upon the number of misclassifications. The measurements of HRV included time domain indices: standard deviation of all normal RR intervals (SDNN) and frequency domain indices. The frequency domain indices were calculated after fast Fourier transformation of three 5-min ECG segments, recorded over 15 min. The highest and lowest values were excluded, and the three remaining values were averaged. As recommended by the Task Force of the European Society of Cardiology and the North American Society of Pacing and Electrophysiology 1996, the power spectrum densities of low frequency (LF) 0.04–0.15 Hz, high frequency (HF) 0.15–0.4 Hz, and the low frequency to high frequency ratio (LF/HF) were calculated. For spectral analysis, the following variables were obtained: the total power (TP) within the frequency range of 0–0.4 Hz, LF power within the frequency range of 0.04–0.15 Hz, HF power within the frequency range 0.15–0.4 Hz, and VHF power in the frequency range greater than .4 Hz.
Image acquisition
Neuroimaging data were collected using a whole-body Philips Achieva 3 T scanner with a 32-channel head coil (Koninklijke Philips N.V., Amsterdam, Netherlands). Participants were placed head-first into the scanner while lying in a supine position. Scanning sessions included a T1-weighted structural MRI scan and two scans utilizing pseudo-continuous ASL (pCASL) protocols (Dai et al. 2008; Wu et al. 2007): one 6 min resting-state scan (see functional connectivity results reported in (Boissoneault et al. 2016) and one 18 min task-based scan (Boissoneault et al. 2018). The current report implemented completely unique analyses of data from the 6-min resting state pCASL scan only.
Whole brain structural images were acquired using a three-dimensional (3D) T1-weighted magnetization-prepared rapid gradient-echo (MP-RAGE) sequence with a field-of-view (FOV) of 240 mm, in-plane resolution of 1 mm × 1 mm, 176 contiguous sagittal slices of 1 mm thickness, TR/TE/flip angle = 7.2 ms/3.2 ms/8°, and imaging time = 4.56 min. ASL data were acquired using a two-dimensional (2D) pseudo-continuous ASL (pCASL) technique with a field-of-view (FOV) of 230 mm, in-plane resolution of 3.2 mm × 3.2 mm, 20 axial slices of 6 mm thickness, 1 mm interslice gap, and TR/TE/flip angle = 4 s/11 ms/90°. ASL was applied at a plane that was 30.5 mm inferior to the lowest imaging slice with a labeling time of 1500 ms, and a post labeling delay time of 1800 ms.
Image preprocessing protocol
Imaging data processing and analyses were performed using MATLAB 2015a (MathWorks, Natick, MA, USA), SPM12 (Wellcome Department of Cognitive Neurology, UK), and ASLtbx (Wang et al. 2008). pCASL scans were corrected for subject motion using a rigid body 6-parameter algorithm included in SPM12. To minimize contamination from potential spurious motion artifacts due to ASL, tagged and control images were motion corrected independently (Wang 2012; Wang et al. 2008). Functional images were then coregistered to the T1-weighted images and spatially smoothed with a Gaussian filter of 6 mm full-width-half-maximum (FWHM) kernel to decrease noise for subsequent image subtraction. Tagged and control pairs were subtracted to create 90 perfusion-weighted images for each slice. The perfusion-weighted time series of each slice was then averaged to create one mean image of cerebral perfusion. The mean perfusion weighted image was used to create a map of CBF using ASLtbx, quantified as ml/100 g/min (Wang et al. 2008). For details regarding the calculation of CBF estimates, see our previous work (Boissoneault et al. 2016). Four-dimensional CBF images were masked to remove out-of-brain voxels and normalized to the SPM12 MNI template.
Regional cerebral blood flow variability analysis
To assess global and regional cerebral blood flow variability (CBFV), a signal variability approach was applied to preprocessed four-dimensional resting state ASL volumes. In this procedure, time series of ASL-derived CBF estimates were extracted using masks of 1) the whole brain; and 2) a set of 7 a priori identified functional networks as defined by Shirer et al. (2012) using the REX toolbox. Functional networks of interest were based on structures and networks previously identified as being perturbed in individuals with CFS, or implicated in fatigue or impaired cognitive/attention function, including the default mode network (DMN), anterior salience network (ASN), higher visual network (HVN), left executive control network (LECN), right executive control network (RECN), posterior salience network (PSN), and precuneus network (PN) (Caseras et al. 2006; Caseras et al. 2008; Cook et al. 2017; Cook et al. 2007; Miller et al. 2014; Okada et al. 2004). CBFV was calculated for the whole brain and each network of interest by extracting the standard deviation of each time series to be exported to SPSS for analysis. Six participants (3 HC and 3 CFS) were excluded from further analysis for technical reasons.
Statistical analysis
SPSS 24 (IBM Corp., Armonk, NY, USA) was used for all statistical analyses. Following descriptive statistics for demographic variables, group (i.e., CFS vs. HC) differences in HRV and CBFV were assessed using t-tests for independent samples. Pearson’s r correlation coefficients were used to characterize the relationship between HRV, CBFV, and self-report measures. Correlations between HRV/CBFV measures and self-report measures were not conducted in HC because they lacked clinical symptoms. Finally, potential moderating effects of HRV on the relationship between CBFV and fatigue in CFS participants were assessed using exploratory multivariate regression. Because univariate analyses indicated HRV measures were not normally distributed (skewness and kurtosis >2), these measures were log-transformed prior to analysis. Effect sizes are presented for all inference tests as Cohen’s d (or dz. for within-subjects comparisons), Pearson’s r, or η2p, as appropriate.
Results
Demographics and subjective ratings
The final sample included 28 participants (14 CFS). Descriptive statistics of age and duration of illness for study participants, as well as PSQI scores and subjective VAS ratings of fatigue, depression, anxiety, and pain taken prior to scanning are presented in Table 1. Participant groups did not differ in age (p = .84, d = .08). However, as expected, CFS participants reported significantly higher levels of fatigue (p < .0001; d = 3.23), pain (p < .0001; d = 3.01), anxiety (p = .001; d = 2.01), and depression (p = .001, d = 1.41), as well as poorer sleep quality (p < .0001; d = 2.34). PSQI total scores did not correlate with fatigue (r = −.12, p = .70), depression (r = .18, p = .58), anxiety (r = .26, p = .42), or pain (r = .14, p = .67) among CFS participants. A paired t-test indicated that overall fatigue ratings between the HRV and the fMRI sessions were not statistically different (t24 = .22, p = .83, dz. = .05).
Table 1.
Demographic, Affective, Heart Rate Variability, and Cerebral Blood Flow Variability Measures
| HC (n = 14) | CFS (n = 14) | t-statistic | p-value | Cohen’s d | |
|---|---|---|---|---|---|
| Age (years) | 49.57 (13.16) | 48.57 (12.11) | .209 | .84 | .08 |
| Illness Duration (years) | – | 12.81 (9.62) | – | – | – |
| PSQI (total score) | 3.84 (2.30) | 11.67 (4.12) | 5.92 | <.0001 | 2.34 |
| Anxiety (0–100 VAS) | 2.85 (6.30) | 41.14 (26.24) | 5.31 | <.0001 | 2.01 |
| Depression (0–100 VAS) | 4.79 (16.22) | 35.07 (25.53) | 3.75 | .001 | 1.41 |
| Pain (0–100 VAS) | 0.50 (1.40) | 42.21 (19.54) | 7.97 | <.0001 | 3.01 |
| Fatigue (Scanning Session; 0–100 VAS) | 6.21 (9.16) | 51.00 (17.35) | 8.54 | <.0001 | 3.23 |
| Fatigue (HRV Session; 0–100 VAS) | 4.38 (9.31) | 53.73 (15.43) | 9.66 | <.0001 | 3.87 |
| Heart Rate (beats per minute) | 65.10 (11.56) | 71.42 (15.01) | 1.09 | .29 | .47 |
| Total Power (TP; log10ms2) | 7.05 (0.85) | 6.66 (1.09) | 1.00 | .33 | .40 |
| Low Frequency Power (LF; log10ms2) | 2.64 (0.45) | 2.38 (0.60) | 1.22 | .23 | .49 |
| High Frequency Power (HF; log10ms2) | 2.51 (0.45) | 2.39 (0.47) | .63 | .53 | .26 |
| Very High Frequency Power (VHF; log10ms2) | 3.59 (0.76) | 3.62 (0.76) | .12 | .90 | .04 |
| Whole Brain CBF (ml/100 g/min) | 46.67 (8.22) | 47.20 (7.47) | .17 | .86 | .07 |
| Default Mode Network CBFV (ml/100 g/min) | 31.40 (16.15) | 33.26 (18.30) | .29 | .78 | .11 |
| Anterior Salience Network CBFV (ml/100 g/min) | 40.50 (17.27) | 45.66 (23.34) | .67 | .51 | .25 |
| Higher Visual Network CBFV (ml/100 g/min) | 35.37 (13.29) | 37.30 (23.16) | .27 | .79 | .10 |
| Left Executive Control Network CBFV (ml/100 g/min) | 35.60 (14.64) | 36.87 (20.79) | .19 | .85 | .07 |
| Right Executive Control Network CBFV (ml/100 g/min) | 35.35 (16.17) | 37.14 (22.50) | .24 | .81 | .09 |
| Posterior Salience Network CBFV (ml/100 g/min) | 30.27 (12.73) | 35.64 (18.20) | .90 | .38 | .34 |
| Precuneus Network CBFV (ml/100 g/min) | 44.67 (22.66) | 50.62 (29.58) | .60 | .56 | .23 |
| Whole Brain CBFV (ml/100 g/min) | 21.43 (9.25) | 22.46 (12.93) | .24 | .81 | .09 |
Whole brain CBF measures
An independent t-test indicated no significant differences in whole brain CBF between HC and CFS participants (t25 = .17, p = .86, d = .07). This null finding from the same study population has been published in a separate analysis (Staud et al. 2018). Whole brain CBF did not correlate with fatigue in CFS patients (r = −.04, p = .89).
HRV measures
Group means and SD of heart rate and HRV measures are presented in Table 1. None differed significantly between HC and CFS participants (all p > .05).
Across the sample, significant associations were identified between VHF and CBFV in several network ROIs, including the higher visual network (r = .43, p = .03), LECN (r = .40, p = .05), PSN (r = .39, p = .05), and precuneus network (r = .50, p = .01). VHF was not significantly correlated with CBFV in the DMN (r = .36, p = .08), RECN (r = .37, p = .07), or whole brain (r = .33, p = .10) (Fig. 1). No other HRV measures were associated with whole brain or regional cerebral blood flow variability (CBFV) metrics (all r < .16, all p > .45).
Fig. 1.

Scatterplots demonstrating significant associations between log-transformed HRV power in the VHF band and CBFV in several brain networks, including a LECN (r = .40, p = .05), b higher visual network (r = .43, p = .03), c precuneus network (r = .50, p = .01), and d PSN (r = .39, p = 05). HRV: Heart Rate Variability; CBFV: Cerebral Blood Flow Variability: LECN: Left executive control network; PSN: Posteror salience network
Among CFS participants, a significant negative association between fatigue ratings and total HRV power (TP) (r = −.70, p = .02) was detected (after removal of one outlier) (see Fig. 2). Significant correlations were not detected between fatigue and low frequency (LF) (r = −.34, p = .28), high frequency (HF) (r = −.16, p = .62), or very high frequency (VHF) (r = −.35, p = .26). No significant associations between HRV metrics and other subjective ratings were detected (r < .50, p > .10). No significant correlations between sleep quality measures (PSQI total score) and HRV measures were detected (p < .07, p > .83).
Fig. 2.
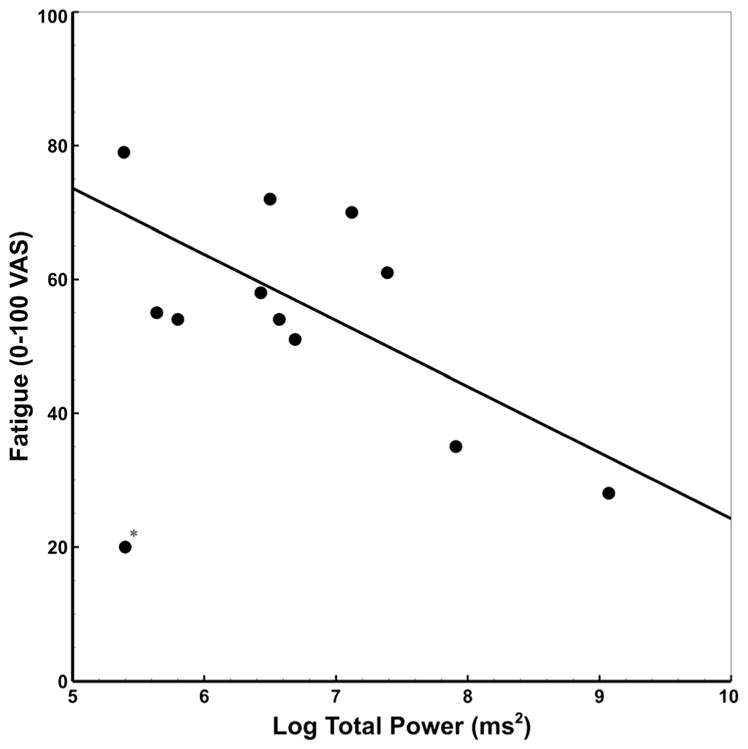
Scatterplot showing the significant correlation between log-transformed total PSD and VAS ratings of fatigue in CFS (after outlier removal, denoted by *; r = −.70, p = .02; with outlier, r = −.32, p = .32). PSD: Power spectrum density
CBFV measures
CBFV measures for both groups are presented in Table 1. As with HRV measures, no significant group differences were found for CBFV in either whole brain (p = .81, d = .09) or any network ROI (all p > .37, all d < .34). Across participants, PSQI did not correlate significantly with CBFV (all r > −.25, all p > .21).
Among CFS patients, significant negative correlations were detected between fatigue and whole brain CBFV (r = −.54, p = .04), as well as higher visual network CBFV (r = −.53, p = .05). Correlations between CBFV in the DMN (r = −.51, p = .06), precuneus (r = −.47, p = .09), and RECN networks (r = −.47, p = .09) and fatigue did not achieve significance. Associations between ASN/PSN and LECN were weaker (all r > −.42, all p > .13). No other significant correlations between self-report and CBFV measures were detected (all r > −.31, all p > .28).
Exploratory multiple regression analysis revealed significant main effects of total HRV power (TP) (β = −26.34; F1,8 = 6.92, p = .03; η2p = .46) and whole brain CBFV (p = .03, β = −5.95, F1,8 = 6.97, p = .03; η2p = .47) on fatigue. These effects were qualified by a significant interaction, suggesting TP moderated the relationship between whole brain CBFV and fatigue ratings (F1,8 = 6.92, p = .05; η2p = .39; p = .05; η2p = .39). After performing a median split on TP, simple main effects analysis was conducted to determine the association between whole brain CBFV and fatigue as a function of TP (‘low’ vs. ‘high’). There was no apparent association between whole brain CBFV and fatigue in CFS participants with high TP (r = .06, p = .91). However, CFS participants with low TP showed a strong relationship between whole brain CBFV and fatigue (r = −.98, p = .001). Comparisons of Fisher’s r-to-z transformed correlation coefficients indicated the difference in correlation between groups was statistically significant (z = −2.89, p = .004). These effects are illustrated in Fig. 3. The same pattern of effects was also noted for CBFV in the higher visual network.
Fig. 3.
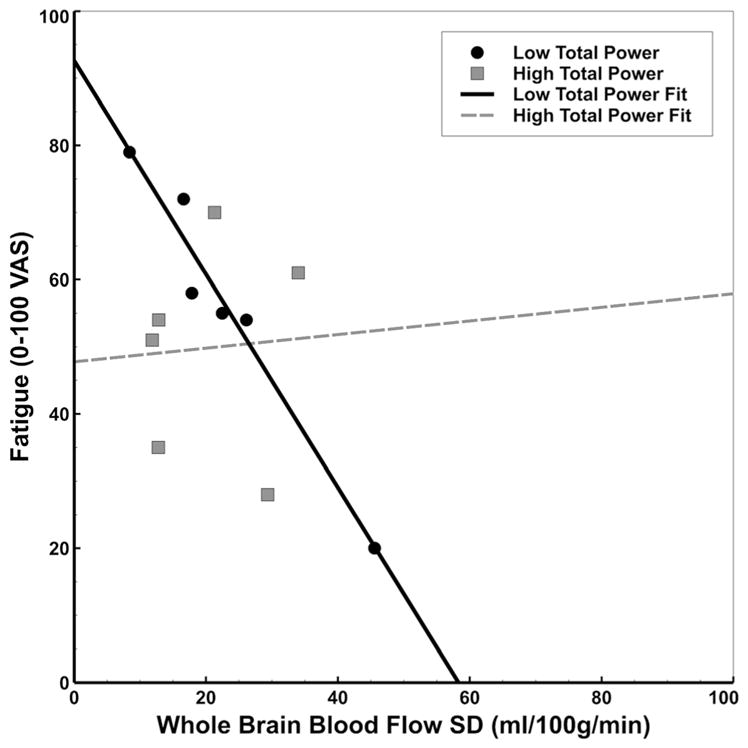
Scatterplot illustrating TP as a moderator of the association between whole brain CBFV and fatigue in CFS participants. In patients with low TP, we detected a strong negative association between CBFV and fatigue (r = −.98; solid line). This relationship was not apparent in patients with relatively high TP (r = .06; dashed line). TP: Total HRV power; CBFV: Cerebral Blood Flow Variability
Discussion
As hypothesized, our results suggest that CBFV was inversely associated with fatigue ratings in individuals with CFS. Specifically, global CBFV and CBFV of structures within the higher visual network provided the strongest indirect support that high CBFV represents a protective factor against fatigue in these patients. Similarly, TP of HRV was negatively correlated with fatigue in individuals with CFS, such that greater TP was associated with less severe symptomatology. Neither CBFV or TP of HRV were significantly correlated with anxiety or depression, providing confidence that the detected relationship between these measures and fatigue was relatively specific in our sample, and not reflective of a more general association with negative affect.
Mounting evidence suggests that resting- and task-related brain signal variability is a potentially important measure of nervous system resilience in chronic illnesses like CFS. Better behavioral performance in healthy individuals and attenuated symptom severity in clinical populations have been associated with greater variability of fMRI signals in task or symptom associated brain regions (Garrett et al. 2013; Takahashi 2013), suggesting that neural networks with higher RSV may be less prone to functional perturbations. A similar relationship was also observed between measurements of HRV and behavioral functioning in healthy individuals and patients (Van Cauwenbergh et al. 2014; Hildebrandt et al. 2016). Similarly, previous work has shown that neurovisceral integration (i.e., neural regulation of the cardiovascular system) is related to cognitive performance, so that higher resting HRV is associated with adaptive prefrontal top-down control of visual perception and attention (Thayer et al. 2009).
To the best of our knowledge, this study is the first to examine CBFV and HRV in the context of fatigue in patients with CFS. Despite expected group differences in fatigue, we did not observe significant differences in the time domains of HRV or CBFV across the whole brain or within specific a priori network nodes. However, we identified a novel association across participant groups between the frequency domains of HRV, i.e. power in the VHF range and CBFV in several network ROIs, including the higher visual network. Furthermore, CFS participants showed an inverse relationship between CBFV in the whole brain and higher visual network and fatigue, so that patients who reported less severe levels of fatigue had higher CBFV. Although trending associations between fatigue and CBFV in other examined networks were suggestive of similar relationships, they did not, however, achieve statistical significance in our sample.
The relationship between measurements of HRV and fatigue can be informative because HRV represents a physiological marker of ANS functioning and resilience (Goldstein et al. 2011). Furthermore, it can be used as a proxy to measure the extent to which ANS function might contribute to CFS symptoms (Van Cauwenbergh et al. 2014). Although we did not identify group-level differences in specific time or frequency domains of HRV, the combined variability across all frequencies (TP) was negatively correlated with fatigue in individuals with CFS such that greater TP was associated with less severe symptomatology. Because TP is the combined variance of each of the HRV frequency bands, it may collectively reflect sympathetic and parasympathetic function (Reyes del Paso et al. 2013). Our results suggest that lower TP, and hence lower autonomic reactivity, is associated with more severe symptomatology in CFS individuals. Therefore, TP may be a potentially important factor to integrate in the physiological assessment of CFS and related conditions. Second, our results suggest that TP might reflect capacity for resilience.
In addition to testing the unique relationships between CBFV and HRV with fatigue, we found that the association between fatigue and global CBFV was moderated by TP, i.e. only CFS participants with low TP showed this effect. Thus, we speculate that, in CFS participants with low ANS reactivity, high CBFV may be critically important for providing symptom resilience. Overall, these findings are consistent with previous studies demonstrating that higher variability of functional brain activity (RSV) is associated with more optimal behavioral outcomes in patients with multiple sclerosis (Petracca et al. 2017). Although it is currently unclear whether RSV and/or CBFV are modifiable factors, future studies should address these measures as potential therapeutic behavioral and pharmacologic targets for individuals with CFS.
Study strengths and limitations
Our data suggest that CBF and HRV may reflect resilience in CFS patients. Additionally, our analyses demonstrate that CBFV and HRV are not independent factors, but are connected. Another strength of our study is that we directly measured CBFV of CFS patients using ASL. In contrast to blood oxygenation level dependent (BOLD) fMRI, which can only indirectly assess changes in cerebral blood flow, use of ASL MRI allowed us to measure the temporal dynamics in blood flow, thought to directly reflect changes in neuronal activity (Chen et al. 2015).
However, the study does have certain limitations. Because of our relatively small sample size and the large number of correlations needed to test hypotheses regarding the relationship between HRV, CBFV, and CFS symptomatology, these associations should be regarded as preliminary until replicated with a larger sample. Furthermore, it is unclear whether the relationship between CBFV and fatigue might change over time because the study was cross-sectional. It is also not clear whether the effects we detected are specific to CFS symptomatology or if the relationship between CBFV and fatigue might be present in individuals with other conditions where fatigue is a major complaint (e.g., cancer, congestive heart failure, multiple sclerosis). Finally, associations between CBFV, HRV, and fatigue were bivariate correlations; therefore, directionality and causality of effects cannot be assumed. Although it is likely that CBFV is causally related to subjective ratings of fatigue in individuals with CFS, and not vice versa, the same directionality relationship cannot be inferred between HRV and CBFV measures.
Conclusions
Our data provide evidence that fatigue symptom severity in CFS is negatively associated with variabilities of CBF and heart rate. In addition, there is a positive association between VHF power of the HRV spectrum and CBFV of several key neural networks, some of which have been associated with chronic fatigue. Future studies are needed to investigate whether abnormal ANS function and/or CBFV are causal factors for CFS and related fatiguing disorders.
Acknowledgments
Funding This study was funded by NIH grant R01 NR014049 and NIH/NCATS Clinical and Translational Science grants UL1 TR000064.
Footnotes
Compliance with ethical standards
Conflict of interest Author Jeff Boissoneault declares that he has no conflict of interest.
Author Janelle Letzen declares that she has no conflict of interest.
Author Michael Robinson declares that he has no conflict of interest.
Author Roland Staud declares that he has no conflict of interest.
Ethical approval All procedures performed in studies involving human participants were in accordance with the ethical standards of the institutional and/or national research committee and with the 1964 Helsinki declaration and its later amendments or comparable ethical standards.
Informed consent Informed consent was obtained from all individual participants included in the study.
References
- Basalyga G, Salinas E. When response variability increases neural network robustness to synaptic noise. Neural Computation. 2006;18(6):1349–1379. doi: 10.1162/neco.2006.18.6.1349. [DOI] [PubMed] [Google Scholar]
- Boissoneault J, Letzen J, Lai S, O’Shea A, Craggs J, Robinson ME, Staud R. Abnormal resting state functional connectivity in patients with chronic fatigue syndrome: An arterial spin-labeling fMRI study. Magnetic Resonance Imaging. 2016;34(4):603–608. doi: 10.1016/j.mri.2015.12.008. [DOI] [PMC free article] [PubMed] [Google Scholar]
- Boissoneault J, Letzen J, Lai S, Robinson ME, Staud R. Static and dynamic functional connectivity in patients with chronic fatigue syndrome: Use of arterial spin labelling fMRI. Clinical Physiology and Functional Imaging. 2018;38(1):128–137. doi: 10.1111/cpf.12393. [DOI] [PMC free article] [PubMed] [Google Scholar]
- Buysse DJ, Reynolds CF, 3rd, Monk TH, Berman SR, Kupfer DJ. The Pittsburgh sleep quality index: A new instrument for psychiatric practice and research. Psychiatry Research. 1989;28(2):193–213. doi: 10.1016/0165-1781(89)90047-4. [DOI] [PubMed] [Google Scholar]
- Caseras X, Mataix-Cols D, Giampietro V, Rimes KA, Brammer M, Zelaya F, Chalder T, Godfrey EL. Probing the working memory system in chronic fatigue syndrome: A functional magnetic resonance imaging study using the n-back task. Psychosomatic Medicine. 2006;68(6):947–955. doi: 10.1097/01.psy.0000242770.50979.5f. [DOI] [PubMed] [Google Scholar]
- Caseras X, Mataix-Cols D, Rimes KA, Giampietro V, Brammer M, Zelaya F, Chalder T, Godfrey E. The neural correlates of fatigue: An exploratory imaginal fatigue provocation study in chronic fatigue syndrome. Psychological Medicine. 2008;38(7):941–951. doi: 10.1017/S0033291708003450. [DOI] [PubMed] [Google Scholar]
- Chen JJ, Jann K, Wang DJ. Characterizing resting-state brain function using arterial spin labeling. Brain Connectivity. 2015;5(9):527–542. doi: 10.1089/brain.2015.0344. [DOI] [PMC free article] [PubMed] [Google Scholar]
- Clayton EW. Beyond myalgic encephalomyelitis/chronic fatigue syndrome: An IOM report on redefining an illness. JAMA. 2015;313(11):1101–1102. doi: 10.1001/jama.2015.1346. [DOI] [PubMed] [Google Scholar]
- Cook DB, O’Connor PJ, Lange G, Steffener J. Functional neuroimaging correlates of mental fatigue induced by cognition among chronic fatigue syndrome patients and controls. Neuro Image. 2007;36(1):108–122. doi: 10.1016/j.neuroimage.2007.02.033. [DOI] [PubMed] [Google Scholar]
- Cook DB, Light AR, Light KC, Broderick G, Shields MR, Dougherty RJ, Meyer JD, VanRiper S, Stegner AJ, Ellingson LD, Vernon SD. Neural consequences of post-exertion malaise in Myalgic encephalomyelitis/chronic fatigue syndrome. Brain, Behavior, and Immunity. 2017;62:87–99. doi: 10.1016/j.bbi.2017.02.009. [DOI] [PubMed] [Google Scholar]
- Dai W, Garcia D, de Bazelaire C, Alsop DC. Continuous flow-driven inversion for arterial spin labeling using pulsed radio frequency and gradient fields. Magnetic Resonance in Medicine. 2008;60(6):1488–1497. doi: 10.1002/mrm.21790. [DOI] [PMC free article] [PubMed] [Google Scholar]
- Evans S, Seidman LC, Tsao JC, Lung KC, Zeltzer LK, Naliboff BD. Heart rate variability as a biomarker for autonomic nervous system response differences between children with chronic pain and healthy control children. Journal of Pain Research. 2013;6:449–457. doi: 10.2147/JPR.S43849. [DOI] [PMC free article] [PubMed] [Google Scholar]
- Faisal AA, Selen LP, Wolpert DM. Noise in the nervous system. Nature Reviews Neuroscience. 2008;9(4):292–303. doi: 10.1038/nrn2258. [DOI] [PMC free article] [PubMed] [Google Scholar]
- Ferreira M, Jr, Zanesco A. Heart rate variability as an important approach for assessment of autonomic modulation. Motriz: Revista de Educação Física. 2016;22(2):3–8. [Google Scholar]
- Fukuda K, Straus SE, Hickie I, Sharpe MC, Dobbins JG, Komaroff A. The chronic fatigue syndrome: A comprehensive approach to its definition and study. International chronic fatigue syndrome study group. Annals of Internal Medicine. 1994;121(12):953–959. doi: 10.7326/0003-4819-121-12-199412150-00009. [DOI] [PubMed] [Google Scholar]
- Garrett DD, Samanez-Larkin GR, MacDonald SW, Lindenberger U, McIntosh AR, Grady CL. Moment-to-moment brain signal variability: A next frontier in human brain mapping? Neuroscience and Biobehavioral Reviews. 2013;37(4):610–624. doi: 10.1016/j.neubiorev.2013.02.015. [DOI] [PMC free article] [PubMed] [Google Scholar]
- Gay CW, Robinson ME, Lai S, O’Shea A, Craggs JG, Price DD, Staud R. Abnormal resting-state functional connectivity in patients with chronic fatigue syndrome: Results of seed and data-driven analyses. Brain Connectivity. 2016;6(1):48–56. doi: 10.1089/brain.2015.0366. [DOI] [PMC free article] [PubMed] [Google Scholar]
- Goldstein DS, Bentho O, Park MY, Sharabi Y. Low-frequency power of heart rate variability is not a measure of cardiac sympathetic tone but may be a measure of modulation of cardiac autonomic outflows by baroreflexes. Experimental Physiology. 2011;96(12):1255–1261. doi: 10.1113/expphysiol.2010.056259. [DOI] [PMC free article] [PubMed] [Google Scholar]
- Hildebrandt LK, McCall C, Engen HG, Singer T. Cognitive flexibility, heart rate variability, and resilience predict fine-grained regulation of arousal during prolonged threat. Psychophysiology. 2016;53(6):880–890. doi: 10.1111/psyp.12632. [DOI] [PubMed] [Google Scholar]
- Komaroff AL, Cho TA. Role of infection and neurologic dysfunction in chronic fatigue syndrome. Seminars in Neurology. 2011;31(3):325–337. doi: 10.1055/s-0031-1287654. [DOI] [PubMed] [Google Scholar]
- Miller AH, Jones JF, Drake DF, Tian H, Unger ER, Pagnoni G. Decreased basal ganglia activation in subjects with chronic fatigue syndrome: Association with symptoms of fatigue. PLoS One. 2014;9(5):e98156. doi: 10.1371/journal.pone.0098156. [DOI] [PMC free article] [PubMed] [Google Scholar]
- Nakatomi Y, Mizuno K, Ishii A, Wada Y, Tanaka M, Tazawa S, Onoe K, Fukuda S, Kawabe J, Takahashi K, Kataoka Y, Shiomi S, Yamaguti K, Inaba M, Kuratsune H, Watanabe Y. Neuroinflammation in patients with chronic fatigue syndrome/Myalgic encephalomyelitis: An (1)(1)C-(R)-PK11195 PET study. Journal of Nuclear Medicine. 2014;55(6):945–950. doi: 10.2967/jnumed.113.131045. [DOI] [PubMed] [Google Scholar]
- Okada T, Tanaka M, Kuratsune H, Watanabe Y, Sadato N. Mechanisms underlying fatigue: Avoxel-based morphometric study of chronic fatigue syndrome. BMC Neurology. 2004;4(1):14. doi: 10.1186/1471-2377-4-14. [DOI] [PMC free article] [PubMed] [Google Scholar]
- Petracca M, Saiote C, Bender HA, Arias F, Farrell C, Magioncalda P, Martino M, Miller A, Northoff G, Lublin F, Inglese M. Synchronization and variability imbalance underlie cognitive impairment in primary-progressive multiple sclerosis. Scientific Reports. 2017;7:46411. doi: 10.1038/srep46411. [DOI] [PMC free article] [PubMed] [Google Scholar]
- Pinneo LR. On noise in the nervous system. Psychological Review. 1966;73(3):242–247. doi: 10.1037/h0023240. [DOI] [PubMed] [Google Scholar]
- Price DD, Bush FM, Long S, Harkins SW. A comparison of pain measurement characteristics of mechanical visual analogue and simple numerical rating scales. [comparative study] Pain. 1994;56(2):217–226. doi: 10.1016/0304-3959(94)90097-3. [DOI] [PubMed] [Google Scholar]
- Puri BK, Jakeman PM, Agour M, Gunatilake KD, Fernando KA, Gurusinghe AI, et al. Regional grey and white matter volumetric changes in myalgic encephalomyelitis (chronic fatigue syndrome): A voxel-based morphometry 3 T MRI study. The British Journal of Radiology. 2012;85(1015):e270–e273. doi: 10.1259/bjr/93889091. [DOI] [PMC free article] [PubMed] [Google Scholar]
- Reyes del Paso GA, Langewitz W, Mulder LJ, van Roon A, Duschek S. The utility of low frequency heart rate variability as an index of sympathetic cardiac tone: A review with emphasis on a reanalysis of previous studies. Psychophysiology. 2013;50(5):477–487. doi: 10.1111/psyp.12027. [DOI] [PubMed] [Google Scholar]
- Rogachov A, Cheng JC, Erpelding N, Hemington KS, Crawley AP, Davis KD. Regional brain signal variability: A novel indicator of pain sensitivity and coping. Pain. 2016;157(11):2483–2492. doi: 10.1097/j.pain.0000000000000665. [DOI] [PubMed] [Google Scholar]
- Shan ZY, Kwiatek R, Burnet R, Del Fante P, Staines DR, Marshall-Gradisnik SM, et al. Progressive brain changes in patients with chronic fatigue syndrome: A longitudinal MRI study. Journal of Magnetic Resonance Imaging. 2016;44(5):1301–1311. doi: 10.1002/jmri.25283. [DOI] [PMC free article] [PubMed] [Google Scholar]
- Shirer WR, Ryali S, Rykhlevskaia E, Menon V, Greicius MD. Decoding subject-driven cognitive states with whole-brain connectivity patterns. Cerebral Cortex. 2012;22(1):158–165. doi: 10.1093/cercor/bhr099. [DOI] [PMC free article] [PubMed] [Google Scholar]
- Sorenson M, Jason L, Peterson J, Herrington J, Mathews H. Brain Derived Neurotrophic Factor is Decreased in Chronic Fatigue syndrome and Multiple Sclerosis. Neurology & Neurophysiology. 2014;12:S2–13. [Google Scholar]
- Staud R, Boissoneault J, Craggs J, Lai S, Robinson ME. Task related cerebral blood flow changes of patients with chronic fatigue syndrome: An arterial spin labeling study. Fatigue: Biomedicine, Health & Behavior. 2018 doi: 10.1080/21641846.2018.1453919. epub ahead of print. [DOI] [PMC free article] [PubMed] [Google Scholar]
- Takahashi T. Complexity of spontaneous brain activity in mental disorders. Progress in Neuro-Psychopharmacology & Biological Psychiatry. 2013;45:258–266. doi: 10.1016/j.pnpbp.2012.05.001. [DOI] [PubMed] [Google Scholar]
- Thayer JF, Hansen AL, Saus-Rose E, Johnsen BH. Heart rate variability, prefrontal neural function, and cognitive performance: The neurovisceral integration perspective on self-regulation, adaptation, and health. Annals of Behavioral Medicine. 2009;37(2):141–153. doi: 10.1007/s12160-009-9101-z. [DOI] [PubMed] [Google Scholar]
- Van Cauwenbergh D, Nijs J, Kos D, Van Weijnen L, Struyf F, Meeus M. Malfunctioning of the autonomic nervous system in patients with chronic fatigue syndrome: A systematic literature review. European Journal of Clinical Investigation. 2014;44(5):516–526. doi: 10.1111/eci.12256. [DOI] [PubMed] [Google Scholar]
- Wang Z. Improving cerebral blood flow quantification for arterial spin labeled perfusion MRI by removing residual motion artifacts and global signal fluctuations. Magnetic Resonance Imaging. 2012;30(10):1409–1415. doi: 10.1016/j.mri.2012.05.004. [DOI] [PMC free article] [PubMed] [Google Scholar]
- Wang Z, Aguirre GK, Rao H, Wang J, Fernandez-Seara MA, Childress AR, et al. Empirical optimization of ASL data analysis using an ASL data processing toolbox: ASLtbx. Magnetic Resonance Imaging. 2008;26(2):261–269. doi: 10.1016/j.mri.2007.07.003. [DOI] [PMC free article] [PubMed] [Google Scholar]
- Wu WC, Fernandez-Seara M, Detre JA, Wehrli FW, Wang J. A theoretical and experimental investigation of the tagging efficiency of pseudocontinuous arterial spin labeling. Magnetic Resonance in Medicine. 2007;58(5):1020–1027. doi: 10.1002/mrm.21403. [DOI] [PubMed] [Google Scholar]
- Wutte MG, Smith MT, Flanagin VL, Wolbers T. Physiological signal variability in hMT+ reflects performance on a direction discrimination task. Frontiers in Psychology. 2011;2:185. doi: 10.3389/fpsyg.2011.00185. [DOI] [PMC free article] [PubMed] [Google Scholar]
- Yang H, Shew WL, Roy R, Plenz D. Maximal variability of phase synchrony in cortical networks with neuronal avalanches. The Journal of Neuroscience. 2012;32(3):1061–1072. doi: 10.1523/JNEUROSCI.2771-11.2012. [DOI] [PMC free article] [PubMed] [Google Scholar]
- Yoshiuchi K, Farkas J, Natelson BH. Patients with chronic fatigue syndrome have reduced absolute cortical blood flow. Clinical Physiology and Functional Imaging. 2006;26(2):83–86. doi: 10.1111/j.1475-097X.2006.00649.x. [DOI] [PubMed] [Google Scholar]