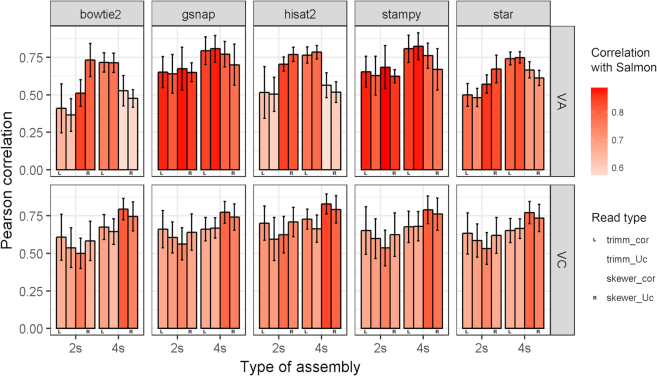
Figure 9:
Correlation of gene count profiles obtained with de novo assemblies and the reference genome. Counts of transcripts aligned to the same reference gene model were added and re-annotated as that gene model. Correlation was calculated on the common set of gene models with non-zero counts on both reference and assemblies by mapping software and read pre-processing (error correction and trimming). Uc stands for uncorrected, cor for corrected, trimm for Trimmomatic. Color indicates mean correlation of reference counts with Salmon, a transcript-specific quantification tool. Values are mean ± standard deviation of eight samples.

