Abstract
Colonic amyloidosis is the result of overexpression of the serum amyloid A (SAA) protein in inflammatory bowel disease or colon cancer. Crucial for amyloid formation are the first ten N-terminal residues, which in the crystal structure are a part of a 27-residue long helix. Here, we study this 27-residue N-terminal region of SAA by a multiexchange variant of replica exchange molecular dynamics. An ensemble of configurations is observed, dominated by three motifs: the single helix of the crystal structure, a helix-turn-helix configurations, and such where the residues 14–27 are the part of a helix but the first 13 residues form an extended and disordered segment that is prone to aggregation. The single point mutation E9A shifts the equilibrium to the latter motif, indicating the importance of interactions involving this residue for the stability of the SAA protein.
Introduction
A large spectrum of diseases is connected with the presence of amyloid fibrils that after staining with Congo red are visible under ultraviolet light. Depending on the specific disease, these deposits are either systemic or localized (for instance, in the patient’s brain in the case of Alzheimer’s disease), and appear either spontaneous or as the consequence or byproduct of another disease.1−5 An example for the latter, so-called secondary, amyloidosis is colonic amyloidosis where in response to inflammation the precursor protein serum amyloid A (SAA) is overexpressed.6 Normally, SAA is found with a concentration of 1–3 μg/mL in human blood, but in patients with colon cancer or inflammatory bowel disease the concentration of SAA can approach more than 1 mg/mL. This extremely high concentration then encourages misfolding and aggregation of SAA, leading to the outbreak of colonic amyloidosis as a secondary disease that adds to the symptoms of the primary disease.7−9
SAA is built out of 104 amino acids; however, in extracellular environment, or in amyloids, one does not find the complete protein but rather the truncated fragment SAA (1–76). The structure of the full-size protein has been resolved by X-ray crystallography10 and deposited in the Protein Data Bank (PDB) under identifier 4IP8. However the crystal structure, shown in Figure 1, is for a hexamer, it is stable for the monomer, and characterized by a long C-terminal tail that wraps four helices corresponding to residues 1–27, 32–47, 50–69, and 73–88.10
Figure 1.
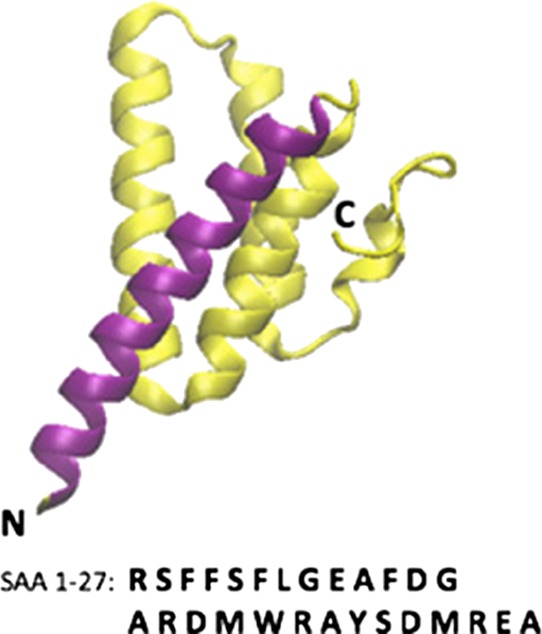
Crystal structure (PDB ID: 4IP8) of the full-size SAA monomer. The purple segment is helix I (residues 1–27). Helix II, III, and IV and the C-terminal tail, consisting of residues 28–104, are drawn in yellow. Labels mark the N- and C-terminals.
From mutation experiments, it is known that the first eleven residues are crucial for the misfolding and aggregation of SAA in colonic amyloidosis as their lacking prevents the aggregation of SAA.11 In the crystal structure, these residues are part of the N-terminal α-helix, but it was proposed by Nordling and Abraham-Nordling12 that residues 1–13 can misfold into a β-hairpin structure whose presence will trigger aggregation. This idea is consistent with Jannone’s observation of Raman spectra seen during SAA (1–12) aggregation,13 and our own simulations which show an equilibrium between α-helix to β-hairpin configurations for the N-terminal segment SAA (1–13) that can be shifted by various single-point mutations.14
A drawback of our previous study is that it considered only an isolated segment formed by residues 1–13. However, in the crystal structure these residues are part of an α-helix spanning from residue 1–27. The local environment formed by this α-helix will likely alter the landscape of the 1–13 segment and the mechanism of the helix-hairpin transition. Such “caching” of residues prone to form β-strands has been also observed for other proteins.15 Note that the stabilizing effect of the other three helices seems to be weak as we observe already in rather short molecular dynamics simulation (40 ns at 310 K), an unraveling of the N-terminal segment for the full-size protein (see Figure S1). For this reason, we extend here our previous study to the segment formed by the first 27 residues of SAA, investigating its structural transitions, and their potential role in the formation of SAA amyloids. For this purpose, we consider not only the wild type, but probe also how landscape and transition mechanism are altered by the mutation of residue 9 from a glutamic acid into an alanine (E9A). However this mutant has not been observed in vivo, it was chosen by us to test the role of a potentially helix-stabilizing salt bridge seen in the wild type at neutral pH (a slat bridge that disappears under acidic conditions known to further amyloid formation). Our results rely on large-scale simulations using a variant replica exchange molecular dynamics (REMD), multiexchange REMD (ME-REMD). This variant raises the efficiency of regular REMD by attempting multiple exchanges of neighboring replicas between the molecular dynamic segments. An additional goal of this paper is to evaluate in a systematic way the gain in efficiency by this approach.
Results and Discussion
System Setup
In the present study, we use molecular dynamics simulations to investigate structural transitions in the N-terminal segment SAA (1–27), a protein implicated in colonic amyloidosis. In order to ensure validity of our results, we have to make certain that the set-up of our simulation does not introduce a bias to our data. Such bias could come, for instance, from a too small simulation box that would cage the molecule and therefore restrict its configurational space. In Figure S2, we present results from short constant temperature (400 K) simulations of the wild-type fragment SAA (1–27) for cubic boxes of length 4.8, 5.4, and 5.6 nm. Shown is the probability of a residue to be part of a helix, strand, or turn. Comparing the results, we find that the results from box sizes 5.4 and 5.6 nm are consistent, but differ from that of box size 4.8 nm. Hence, we conclude that a box size of atleast 5.4 nm is necessary in simulations to minimize the finite size effects.
In a similar way, we need to make sure that the temperature distribution allows a walk of replicas through temperature space, and that the highest temperature is sufficiently large to enable crossing of all relevant barriers in the system. The lowest temperature is given by our target temperature, T = 300 K. Short constant temperature runs indicate that a temperature of T = 420 K is sufficient to dissolve the helix, and for this reason we choose T = 420 K as our maximal temperature. The distribution of temperatures between the two extremes can be determined for a given number of replicas by the algorithm of van der Spoel.16 Especially, we find that 36 replicas lead to an average acceptance probability of 18%, which we consider acceptable. Simulating the wild type with this box size and temperature distribution for 300 ns, and evaluating various quantities, such as the secondary structure probability of certain segments, for different time intervals, we find that a regular REMD simulation converges within 200 ns. Hence, this set-up for regular REMD (see Figure S3) is used as our standard against which we compare all considered variants when testing the efficiency of ME-REMD.
Comparing the Efficiency of REMD and ME-REMD Sampling
REMD is a method to enhance sampling of configurations in systems where large barriers in the energy landscape lead to slow sampling. REMD alleviates this problem by introducing a walk through temperature space. At high temperatures, barriers can be easily crossed, whereas at low temperatures more relevant low-energy configurations are explored. A disadvantage of this technique is that the temperature spacing decreases with increasing system size (or otherwise the acceptance for exchange moves becomes vanishingly small). This makes simulations of proteins in explicit water (i.e., where the system consists of the protein and a much larger number of water molecules) cumbersome. One way to raise the effective transition rate is to attempt multiple exchanges between two neighboring replicas.17 As a consequence, a given replica can cover a large range of temperatures between two molecular dynamics segments if a series of exchange attempts between pairs of neighboring replicas are made, resulting in a faster walk in temperature space. However it appears reasonable to assume that such an approach will lead to improved sampling, it is important to explore systematically the gain in efficiency that can be obtained, and how this gain depends on the number of such exchange attempts within one exchange cycle.
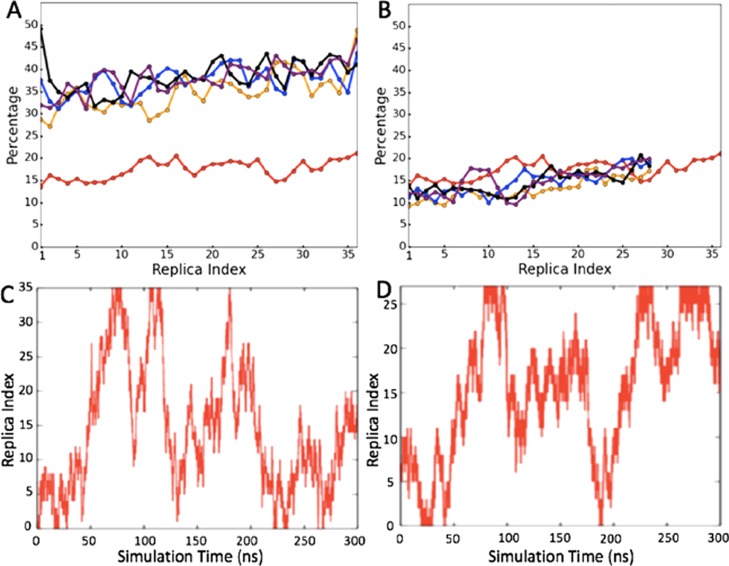
Hence, in a first step we took our system of 36 replicas, which we had simulated with regular REMD; and varied the number N of exchange attempts. Specifically, we considered the cases N = 1 (regular REMD), 5, 10, 20, and up to N = 100. The resulting effective exchange rates for the various temperature pairs are shown in Figure 2a. These rates suggest a fast approach to an optimum, with increasing the number of attempts beyond N = 10 not raising the effective exchange rate further in a noticeable way. Here, we define the effective exchange rate by the number of times where, after the series of N exchanges, the final and initial configurations of a replica differ. As a consequence of the higher exchange rate, replicas walk faster in temperature space. This can be seen in Table 1 where we list the number of tunneling events and average tunneling times for various N. Here, we define a tunneling event as the walk of a replica through the temperature space, from the lowest temperature to the highest temperature and back, see Figure 2c,d for illustration. Note in Table 1, the much faster walk in temperature space with ME-REMD is seen than for regular REMD.
Figure 2.
(A) Observed exchange rate in simulations of the SAA (1–27) fragment, the red line is the exchange rate for 36-replica REMD, and orange, blue, black, and purple lines stand for the accumulated exchange rate in ME-REMD with N = 5, 10, 20, and 100. (B) Orange, blue, black, and purple lines stand again for the accumulated exchange rate in ME-REMD with N = 5, 10, 20, and 100, but now for a simulation with only 28 replicas distributed over the same temperature interval of 200–420 K; for comparison we also show the regular REMD simulation of the 36-replica system. A typical replica walking in temperature space is shown in (C) for regular REMD (36 replica); and in (D) for the 28-replica ME-REMD simulation.
Table 1. Number of Tunneling Events, Average Tunneling Time, and Average Exchange Rate over 300 ns for Regular REMD and ME-REMDa.
| systems | time interval (ns) | tunneling event number | average tunneling time (ns) | average exchange rate (%) |
|---|---|---|---|---|
| 36 replicas REMD WT | 0–300 | 46(1) | 47.7(3.8) | 17.9(0.2) |
| 28 replicas ME-REMD WT | 0–300 | 40(5) | 54.6(7.1) | 14.7(0.1) |
| 28 replicas ME-REMD mutation E9A | 0–300 | 30(3) | 59.4(4.1) | 11.3(0.1) |
The various quantities are defined in the text.
One possible application of the increased effective exchange rates and faster walk in temperature space is the possibility to use ME-REMD with a smaller number of replicas than needed for regular REMD. Varying the number of replicas in the same temperature interval of T = 300 K to T = 420 K from M = 36 to M = 28, we measured again for various numbers N of exchange attempts the resulting effective exchange rates, and plot these in Figure 2b. As in the case of M = 36 replicas, the effective exchange rate approaches an optimum for N ≈ 10. For M = 28, replicas correspond this optimal effective exchange rate to the one seen when the original system (M = 36) is simulated with regular REMD. In a similar way, the number of tunneling events agree with average tunneling times, see Table 1. For illustration, we show both the 36 REMD and the 28 ME-REMD simulations example walks of replicas through temperature space in Figure 2c,d. Hence, by using ME-REMD instead of regular REMD we reduce the number of replicas in our system from M = 36 to M = 28 replicas, a reduction of computational resources by more than 20%!
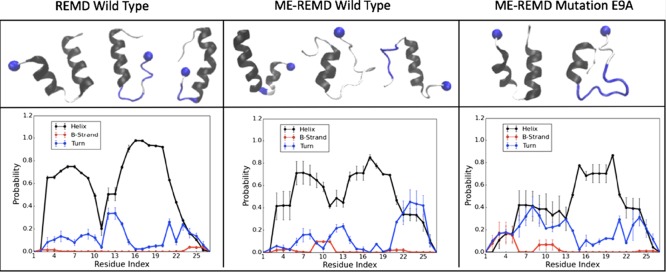
Various approaches have been proposed in the past that result into faster walks through temperature space. In some cases, these approaches lead to biased sampling and nonreliable results. In order to exclude this possibility, we compare in Figure 3 the secondary structure propensity of the residues as measured with regular REMD for our original system of M = 36 replicas, with the data measured in our ME-REMD simulation of the system with M = 28 replicas. In both cases, we find a propensity for the formation of α-helices of about 50%, 51% for ME-REMD, and 55% for REMD, and substantial propensity for turn and β-strand formation, see the left and middle panel of Figure 3. In both REMD and ME-REMD results, we observed that the wild-type SAA (1–27) fragment has a tendency for the helix to break around residue 11–13. The qualitative and quantitative similarity between the two runs shows that the enhanced sampling in ME-REMD does not introduce any biases into our simulation; and for our further analysis we therefore rely on the data obtained with ME-REMD sampling.
Figure 3.
Secondary structure frequency (lower row) and representative configurations for the dominant motifs (upper row) as found in REMD simulations with 36 replicas of the wild-type SAA (1–27) fragment (left panel), in ME-REMD simulations with 28 replicas of the wild-type SAA (1–27) fragment (middle panel), and in ME-REMD simulations with 28 replicas of the E9A mutant SAA (1–27) fragment (right panel). The frequency of α-helices is drawn in black, that of turns in blue, and of β-strands in red. The same color coding is used in the figures in the upper panel, with blue balls marking the N terminal of the segments.
Configurational Ensemble of SAA (1–27) Monomers
However in the crystal structure of ref (11), all 27 residues form an α-helix, the helix propensity is reduced in our simulations, with a break of the helix around residues 11–13. These results are consistent with previous experiments, showing that the truncation of the first eleven residues can prevent aggregation. Our data indicate three regions: helix Ia (residue 1–11), turn (residue 12–13), and helix Ib (residue 14–27). As the first segment, residues 1–11 have a lower helicity than the segment formed by residues 14–27, it follows that the helix Ia is less stable than helix Ib, and its presence or lack of therefore may well be the key enabling aggregation.
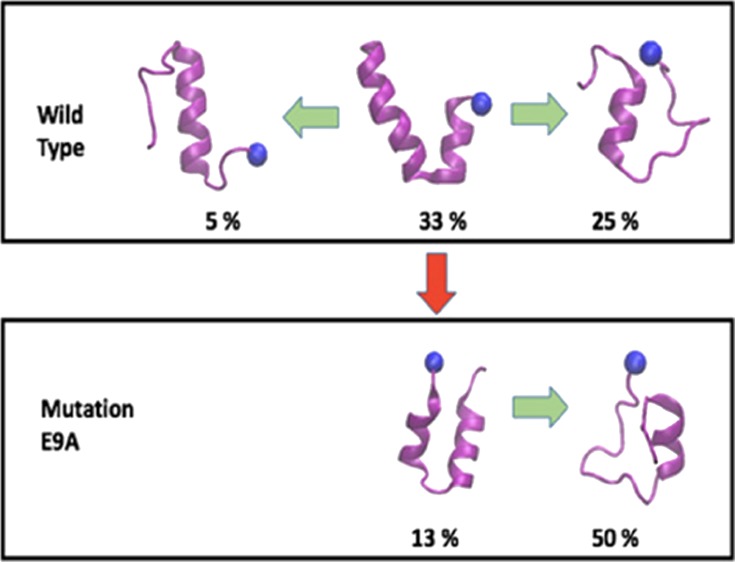
The secondary structure propensity distribution is consistent with our clustering analysis where we group configurations according to the secondary structure propensity of residues 1–11 and 14–21 (residues 22–27 are always helical and therefore ignored for clustering). We find three main clusters. The first cluster is made of configurations with a helix-turn-helix hairpin, with atleast five consecutive residues in each of the two segments identified as helical, but separated by atleast two residues that are not helical. The second cluster is made of configurations with a stable helix Ib (again defined by the requirement of atleast five helical residues in the segment 14–21), but where the N-terminal residues 1–11 form an elongated, disordered, and dynamically changing segment (with no more than three consecutive helical residues). Finally, the configurations in the third cluster are characterized by single long helices, resembling the crystal structure for this fragment, and are defined by the requirement of a single helix of at least 14 residues covering both segments. Example configurations are shown in the upper level of the left and middle panel of Figure 3. The helix-turn-helix cluster has the largest population and contains about 33% of all configurations. The second largest group is the disordered N-terminal cluster consisting of about 25% of configurations. The lowest frequency (5%) is seen for configurations with the native structure-like single extended helix. The various frequencies are listed in Table 2.
Table 2. Percentage of Population of different Type of Clusters for Different Systems.
| systems | helix-turn-helix (%) | N-terminus dynamic (%) | straight helix (%) |
|---|---|---|---|
| ME-REMD wild type | 33 (2) | 25 (9) | 5 (2) |
| ME-REMD mutation E9A | 13 (1) | 49.7 (0.3) | 0 |
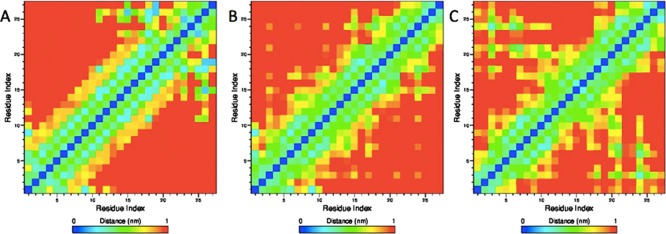
The above results raise the question on what breaks the extended helix seen in the crystal structure, what leads to the dominance of the helix-turn-helix hairpin motif, and how is this all connected to the role of the first 11 residues in amyloid formation of SAA? Residue 13 is a glycine and residue 14 is an alanine, and both residues make it likely to break the helix in this segment. Residue 11 is a phenylalanine whose aromatic sidechain may form a weak hydrophobic contact with residue 21Y to break the extended helix motif and stabilize the helix-turn-helix motif, shown in Figure 4B. Residue 12 is an aspartic acid, and Figure 4A,B indicates that there is a weak contact between residue 1R and residue 12D sidechain in the extended helix motif that is not observed in the helix-turn-helix motif. Hence, the two residues may form a transient salt bridge which stabilizes the extended helix motif, whereas on the contrary the helix-turn-helix motif is preferred when the salt bridge dissolves. Hence, while helix 1 (residues 1–27) is stable in the crystal structure of the full protein as a hexamer, the higher flexibility of the much smaller segment SAA (1–27) allows this helix to break up around residues 12 and 13 into two segments, the N-terminal helix Ia (residues 1–11) and Ib (residues 14–27).
Figure 4.
Sidechain–sidechain contact map as calculated from our ME-REMD simulations of the SAA (1–27) fragment. The results obtained for the case that the wild-type peptide assumes the extended helix motif seen in the PDB structure are shown in (A). Correspondingly, we show this map for the case of the wild-type peptide in the helix-turn-helix configuration in (B). Note the strong signal for a salt bridge between residues 1R and 9E sidechain and the hydrophobic contacts between residues 3F, 21Y, and 24M are missing in the PDB structure. By design is the salt bridge between residues 1 and 9 missing in the contact map of the E9A mutant in the helix-turn-helix configuration, shown in (C). Instead, we find here a signal for a salt bridge between residue 1R and 26E, and for hydrophobic interaction between residue 3F and 21Y or 24M.
In order to understand better the appearance of the helix-hairpin motif, we calculate the contributions of each residue to the solvent accessible surface area (SASA) and compare the obtained values for the different motifs. The corresponding values are shown in Figure 5. In helix-hairpin configurations, the hydrophobic residues 3F, 21Y, and 24 are less exposed to water than in the straight helix of the crystal structure. Hence, we conclude that the helix hairpin is stabilized by hydrophobic contacts involving these residues as shown in Figure 4B, that do not exist in the elongated helix of the crystal structure (see Figure 4A).
Figure 5.
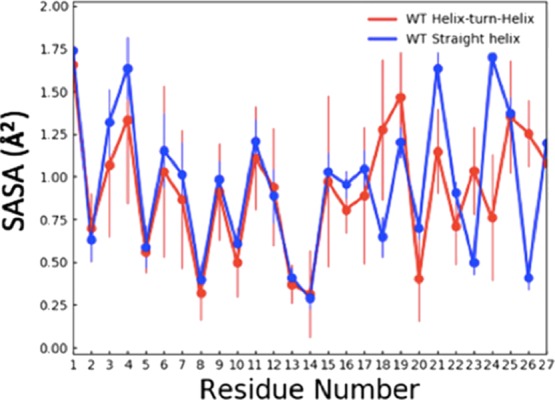
SASA of each residue as measured in our ME-REMD simulations when the SAA (1–27) fragment is in either a helix-turn-helix configuration (red) or in the elongated helix also seen in the PDB structure (blue).
In earlier work,10 we have studied the segment SAA (1–13) which includes the helix Ia forming residues. These previous results established a conformational transition between an α-helix and a β hairpin that is associated with the dissolving and forming of salt bridges involving residues 1R, 5S, 9E, and 12D. Specifically, by comparing the wild type with suitable mutants we found that the salt bridge between 1R and 9E stabilizes the helix structure, as the helix propensity for this fragment vanished in the mutant E9A. A corresponding analysis of the contact map of the wild-type SAA (1–27) in Figure 4B also indicates that the N-terminal helix Ia is stabilized in the helix-turn-helix configuration by electrostatic interactions between the charged residues 1R and 9E, which are within 0.45 nm, and therefore have a high probability to form a salt bridge. We conjecture that the hydrophobic contacts between the helices Ia and Ib favor a helix hairpin; however, the propensities of residues 1–11 to form helix Ia are weak, and require an alignment of residues enforced by the salt bridge between residue 1R and 9E. Loss of this salt bridge leads to a transition of the helix-hairpin structure to configurations with helix Ib intact but the N-terminal residues forming a dynamically changing disordered elongated segment (see Figure 3c) with transient β-strands that is prone to aggregation.
In order to test this hypothesis, we have performed additional ME-REMD simulations of the E9A mutant, using the temperature distribution and number of replicas as for the wild type. Acceptance rates and tunneling times are also listed in Table 1. Comparing the mutant with the wild type, we find indeed a lower propensity for helix formation in the first 11 residues, and an increase of turn formation to 40%, see the middle and right panel of Figure 3.
As a consequence, we observe only two dominant clusters for the E9A mutant, with the frequency of the straight helix, seen in the crystal structure too low to be observable in our simulation. If the mutant is forced into such a configuration, it will decay. This can be seen in Figure S4 where we show the secondary structure frequencies measured in a molecular dynamics run of 100 ns at 310 K, which started from the mutant in the straight helix structure. On the other hand, the frequency of helix-hairpin configurations decreases to 13% compared with the 33% in wild type, and on the contrary, the content of aggregation-prone configurations lacking helix Ia grows to 50% compared with the 25% in wild type, see Table 2.
Hence, the replacement of a charged lysine by an alanine as residue 9, makes the N-terminal of SAA more flexible, increasing the population of aggregation-prone configurations. However, the loss of the salt bridge between residues 1 and 9 does not completely destabilizes helix Ia. Instead, this helix is still weakly stabilized by a salt bridge between the first residue 1R and residue 26E, and a larger number of hydrophobic contacts between residue 3F and 21Y or 24M, which together restrict fluctuations of helix hairpin configurations. These contacts can be seen in Figure 4C, and also the SASA contributions of residues 3F, 21Y, and 24M. Specifically, the residue 3F has in the E9A mutant about 0.3 Å2 less surface exposed to solvent than in the wild type. The difference is with about 0.2 Å2 similar for residues 21Y and 24M.
Conclusions
In this study, we have used a variant of the replica exchange molecular dynamic, ME-REMD, to investigate the conformational ensemble of the isolated N-terminal segment (1–27) of SAA. In the folded structure, these residues form a single extended helix, but especially residues 1–11 are implicated in the amyloid formation of the overexpressed protein. Our first result is that ME-REMD is robust and depends little on the number of exchange attempts; that is the improved sampling efficiency is not bought by the need to adjust an additional parameter. The rather trivial modification of REMD leads to immediate gains of about 20% in sampling efficiency or reduction of required computational resources.
However a noteworthy result, our main interest is in the dynamics of the long helix formed by residue 1–27 in the crystal structure. This helix is not stable in our simulations of the isolated fragment SAA (1–27). Instead, the helix breaks up around residues 12 and 13 in a more than 50% of configurations. The resulting helix hairpin is held together by hydrophobic contacts between helix Ia (residues 1–11) and helix Ib (residues 14–27); however, this motif is itself not stable as helix Ia is only weakly hold together by a salt bridge between residues 1R and 9E. Hence, in about 25% of configurations this helix Ia dissolves and the residues 1–11 form a dynamically changing elongated segment, with the transient β-strand content that in a more dense environment would become the starting point for aggregation. Mutation of residue 9 from a glutamic acid to an alanine destroys the salt bridge, shifting the equilibrium away from the helix-hairpin toward a motif with increased β-strand content as also seen in our earlier simulations of the short fragment SAA (1–13).
We conjecture that a similar mechanism also applies for the full-length protein. However here the N-terminal helix I is likely stabilized by residues 28–76, we expect that it also exist in a dynamical equilibrium with an unstable helix-hairpin configuration where the first eleven residues may form transient β-strands that become the nucleus for the aggregation observed in vivo for overexpressed SAA. This scenario is supported by experimental observations showing a reduction of helicity at pH = 2,18 and an increase in fibril formation when the SAA (1–27) segment binds with acidic lysophospholiqids instead of neutral lysophospholiqids.19 Because the wild type SAA (1–11) fragment has an isoelectric point of 6.0, whereas that of the E9A mutant is 9.8 (as calculated by the ExPASy Server20−22), the loss of charge at residue 9 because of the mutation E9A is similar to going in the wild type from neutral pH to acidic conditions. Hence, the experimental measurements are consistent with the mechanism that we have derived from molecular dynamics studies of a wild type and mutant SAA fragment.
Materials and Methods
The initial configuration is derived from the corresponding fragment (residue 1–27) of the crystal structures of full-length SAA protein 1.1 (PDB ID: 4IP8). The mutation-type SAA (1–27) E9A was built from the wild-type by replacing the negatively charged side chain of glutamic acid with the hydrogen atom of the alanine side chain. The so-obtained configurations of wild-type and mutant are together with 4700 water molecules placed in a box with box size 5.4 nm and periodic boundary conditions, and melted by molecular dynamics simulation at 500 K to generate random configurations as the starting point for the molecular dynamics simulation in this study.
These simulations are done with the GROMACS 4.5.6 software package.23 The CHARMM 27 force field with CMAP and TIP3P water model24,25 CHARMM TIP3P is employed in replica exchange molecular dynamics (REMD) and ME-REMD of the SSA (1–27) fragment in the isothermal-isobaric (NPT) ensemble.23 Each replica is followed over 300 ns. For REMD, the system contains 36 replicas, spread between 300 and 420 K, for ME-REMD only 28 replicas are distributed over this temperature interval. The temperatures are controlled by velocity rescaling26 and the pressure is kept at 1 bar by the isotropic Parrinello–Rahman’s method. Constraining peptide bonds with LINCS27 allows us to integrate the equations of motions with a time step of 2 fs. Replica exchange is attempted every 1000 steps, method is employed to maintain a constant temperature26 and is involved to keep a constant pressure at 1 bar. Because we use periodic boundary conditions are long-range electrostatic interactions calculated with the Particle–Mesh–Ewald28 algorithm using a 1 nm cutoff. The same cutoff is employed for the calculation of van der Waals interactions.
For the data analysis, we omit the first 200 ns to allow the system to reach equilibrium. Only the 310 replica is considered in REMD simulations. As the ME-REMD simulations rely on a smaller number of replicas (28 instead of 36), the temperature distribution differs. We therefore choose in ME-REMD simulations the replica with a temperature that is closest to 310 K. This is the 308 K replica. The secondary structure of configurations is calculated with the PROSS algorithm,29 which relies on measurements of dihedral angles only. Configurations were the cluster with an in house tool defining the clusters by certain geometric motifs (such as extended helices and helix-hairpin) of the configurations. Sidechain contact maps were derived using the gromacs tool g_mdmat which is based on the mean distance between each residue. The SASA analysis is conducted by using gromacs tool g_sas.
Acknowledgments
Simulations were done on the SCHOONER cluster of the University of Oklahoma and the Extreme Science and Engineering Discovery Environment (XSEDE) which is supported by the National Science Foundation (NSF). Computing time was awarded under grant MCB160005. We acknowledge financial support from National Institutes of Health (NIH) under research grant GM120634.
Supporting Information Available
The Supporting Information is available free of charge on the ACS Publications website at DOI: 10.1021/acsomega.8b02377.
Effect on other helix on helix I; box size that minimize finite size effects; distribution of potential energies of replicas in between 300-420 K; break-up of helix I helix in the mutant E9A (PDF)
The authors declare no competing financial interest.
Supplementary Material
References
- Chiti F.; Dobson C. M. Protein misfolding, functional amyloid, and human disease. Annu. Rev. Biochem. 2006, 75, 333–366. 10.1146/annurev.biochem.75.101304.123901. [DOI] [PubMed] [Google Scholar]
- Eisenberg D.; Jucker M. The amyloid state of proteins in human diseases. Cell 2012, 148, 1188–1203. 10.1016/j.cell.2012.02.022. [DOI] [PMC free article] [PubMed] [Google Scholar]
- Fändrich M.; Schmidt M.; Grigorieff N. Recent progress in understanding Alzheimer’s β-amyloid structures. Trends Biochem. Sci. 2011, 36, 338–345. 10.1016/j.tibs.2011.02.002. [DOI] [PMC free article] [PubMed] [Google Scholar]
- Hazenberg B. P. C. Amyloidosis. Rheum. Dis. Clin. 2013, 39, 323–345. 10.1016/j.rdc.2013.02.012. [DOI] [PubMed] [Google Scholar]
- Sipe J. D.; Benson M. D.; Buxbaum J. N.; Ikeda S.-i.; Merlini G.; Saraiva M. J.; Westermark P.. Nomenclature 2014: Amyloid Fibril Proteins and Clinical Classification of the Amyloidosis; Taylor & Francis, 2014. [DOI] [PubMed] [Google Scholar]
- Pettersson T.; Konttinen Y. T.; Maury C. P. J. Treatment strategies for amyloid A amyloidosis. Expert Opin. Pharmacother. 2008, 9, 2117–2128. 10.1517/14656566.9.12.2117. [DOI] [PubMed] [Google Scholar]
- Gillmore J. D.; Lovat L. B.; Persey M. R.; Pepys M. B.; Hawkins P. N. Amyloid load and clinical outcome in AA amyloidosis in relation to circulating concentration of serum amyloid A protein. Lancet 2001, 358, 24–29. 10.1016/s0140-6736(00)05252-1. [DOI] [PubMed] [Google Scholar]
- Lachmann H. J.; Goodman H. J. B.; Gilbertson J. A.; Gallimore J. R.; Sabin C. A.; Gillmore J. D.; Hawkins P. N. Natural history and outcome in systemic AA amyloidosis. N. Engl. J. Med. 2007, 356, 2361–2371. 10.1056/nejmoa070265. [DOI] [PubMed] [Google Scholar]
- Westermark G. T.; Westermark P. Prion-like aggregates: infectious agents in human disease. Trends Mol. Med. 2010, 16, 501–507. 10.1016/j.molmed.2010.08.004. [DOI] [PubMed] [Google Scholar]
- Lu J.; Yu Y.; Zhu I.; Cheng Y.; Sun P. D. Structural mechanism of serum amyloid A-mediated inflammatory amyloidosis. Proc. Natl. Acad. Sci. U.S.A. 2014, 111, 5189–5194. 10.1073/pnas.1322357111. [DOI] [PMC free article] [PubMed] [Google Scholar]
- Egashira M.; Takase H.; Yamamoto I.; Tanaka M.; Saito H. Identification of regions responsible for heparin-induced amyloidogenesis of human serum amyloid A using its fragment peptides. Arch. Biochem. Biophys. 2011, 511, 101–106. 10.1016/j.abb.2011.04.019. [DOI] [PubMed] [Google Scholar]
- Nordling E.; Abraham-Nordling M. Colonic amyloidosis, computational analysis of the major amyloidogenic species, Serum Amyloid A. Comput. Biol. Chem. 2012, 39, 29–34. 10.1016/j.compbiolchem.2012.06.005. [DOI] [PubMed] [Google Scholar]
- Jannone J. M.; Grigg J. I.; Aguirre L. M.; Jones E. M. Electrostatic Interactions at N- and C-Termini Determine Fibril Polymorphism in Serum Amyloid A Fragments. J. Phys. Chem. B 2016, 120, 10258–10268. 10.1021/acs.jpcb.6b07672. [DOI] [PubMed] [Google Scholar]
- Bernhardt N. A.; Xi W.; Wang W.; Hansmann U. H. E. Simulating protein fold switching by replica exchange with tunneling. J. Chem. Theory Comput. 2016, 12, 5656–5666. 10.1021/acs.jctc.6b00826. [DOI] [PubMed] [Google Scholar]
- Mohanty S.; Meinke J. H.; Zimmermann O.; Hansmann U. H. E. Simulation of Top7-CFr: A transient helix extension guides folding. Proc. Natl. Acad. Sci. U.S.A. 2008, 105, 8004–8007. 10.1073/pnas.0708411105. [DOI] [PMC free article] [PubMed] [Google Scholar]
- Patriksson A.; van der Spoel D. A temperature predictor for parallel tempering simulations. Phys. Chem. Chem. Phys. 2008, 10, 2073–2077. 10.1039/b716554d. [DOI] [PubMed] [Google Scholar]
- Rhee Y. M.; Pande V. S. Multiplexed-replica exchange molecular dynamics method for protein folding simulation. Biophys. J. 2003, 84, 775–786. 10.1016/s0006-3495(03)74897-8. [DOI] [PMC free article] [PubMed] [Google Scholar]
- McCubbin W. D.; Kay C. M.; Narindrasorasak S.; Kisilevsky R. Circular-dichroism studies on two murine serum amyloid A proteins. Biochem. J. 1988, 256, 775–783. 10.1042/bj2560775. [DOI] [PMC free article] [PubMed] [Google Scholar]
- Tanaka M.; Nishimura A.; Takeshita H.; Takase H.; Yamada T.; Mukai T. Effect of lipid environment on amyloid fibril formation of human serum amyloid A. Chem. Phys. Lipids 2017, 202, 6–12. 10.1016/j.chemphyslip.2016.11.004. [DOI] [PubMed] [Google Scholar]
- Bjellqvist B.; Basse B.; Olsen E.; Celis J. E. Reference points for comparisons of two-dimensional maps of proteins from different human cell types defined in a pH scale where isoelectric points correlate with polypeptide compositions. Electrophoresis 1994, 15, 529–539. 10.1002/elps.1150150171. [DOI] [PubMed] [Google Scholar]
- Bjellqvist B.; Hughes G. J.; Pasquali C.; Paquet N.; Ravier F.; Sanchez J.-C.; Frutiger S.; Hochstrasser D. The focusing positions of polypeptides in immobilized pH gradients can be predicted from their amino acid sequences. Electrophoresis 1993, 14, 1023–1031. 10.1002/elps.11501401163. [DOI] [PubMed] [Google Scholar]
- Gasteiger E.; Hoogland C.; Gattiker A.; Wilkins M. R.; Appel R. D.; Bairoch A.. Protein identification and analysis tools on the ExPASy server. The Proteomics Protocols Handbook; Springer, 2005; pp 571–607. [Google Scholar]
- Pronk S.; Páll S.; Schulz R.; Larsson P.; Bjelkmar P.; Apostolov R.; Shirts M. R.; Smith J. C.; Kasson P. M.; van der Spoel D.; Hess B.; Lindahl E. GROMACS 4.5: a high-throughput and highly parallel open source molecular simulation toolkit. Bioinformatics 2013, 29, 845–854. 10.1093/bioinformatics/btt055. [DOI] [PMC free article] [PubMed] [Google Scholar]
- Brooks B. R.; Bruccoleri R. E.; Olafson B. D.; States D. J.; Swaminathan S.; Karplus M. CHARMM: a program for macromolecular energy, minimization, and dynamics calculations. J. Comput. Chem. 1983, 4, 187–217. 10.1002/jcc.540040211. [DOI] [Google Scholar]
- Jorgensen W. L.; Chandrasekhar J.; Madura J. D.; Impey R. W.; Klein M. L. Comparison of simple potential functions for simulating liquid water. J. Chem. Phys. 1983, 79, 926–935. 10.1063/1.445869. [DOI] [Google Scholar]
- Bussi G.; Donadio D.; Parrinello M. Canonical sampling through velocity rescaling. J. Chem. Phys. 2007, 126, 014101. 10.1063/1.2408420. [DOI] [PubMed] [Google Scholar]
- Hess B.; Bekker H.; Berendsen H. J. C.; Fraaije J. G. E. M. LINCS: a linear constraint solver for molecular simulations. J. Comput. Chem. 1997, 18, 1463–1472. . [DOI] [Google Scholar]
- Darden T.; York D.; Pedersen L. Particle mesh Ewald: An N·log(N) method for Ewald sums in large systems. J. Chem. Phys. 1993, 98, 10089–10092. 10.1063/1.464397. [DOI] [Google Scholar]
- Fleming P. J.; Gong H.; Rose G. D. Secondary structure determines protein topology. Protein Sci. 2006, 15, 1829–1834. 10.1110/ps.062305106. [DOI] [PMC free article] [PubMed] [Google Scholar]
Associated Data
This section collects any data citations, data availability statements, or supplementary materials included in this article.


