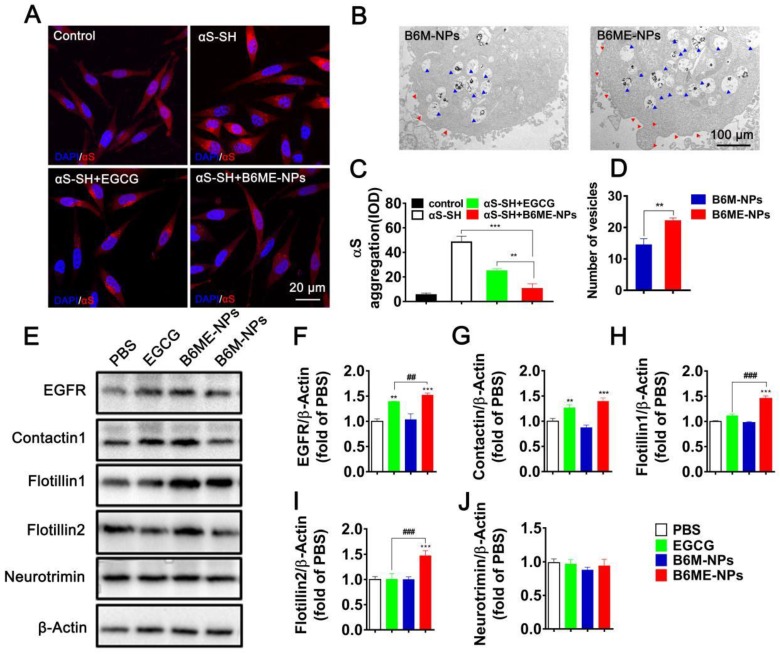
Figure 4.
The role of B6ME-NPs in vitro. (A) αS-overexpression in SH-SY5Y cells as a PD cell model was detected via CLSM. Nuclei: DAPI, blue; control cells: mCherry, red; αS-SH: mCherry-SNAC, red. Scale bar: 20 μm. (B) The TEM images showing the differences of of vesicles and cell membrane curvature induced by B6M-NPs or B6MA-NPs in SH-SY5Y cells (48 h). Red triangles mark curvature, blue triangles mark vesicles. Scale bar: 2 μm. (C) Quantitation of (A). (D) Quantitation of vesicular NPs in (B). (E) Expressions of lipid raft-related proteins (EGFR, Contactin1, flotillin1, flotillin2 and neurotrimin) detected by Western Blot. (F-J) Quantitation of each protein in (E). Error bars represent mean ± SD (n = 3). *P < 0.05, **P < 0.01, ***P < 0.001; (Tg + PBS), (Tg + B6ME-NPs) vs. WT. #P < 0.05, ##P < 0.01, ###P < 0.001; (Tg + EGCG) vs. (Tg + B6ME-NPs).

