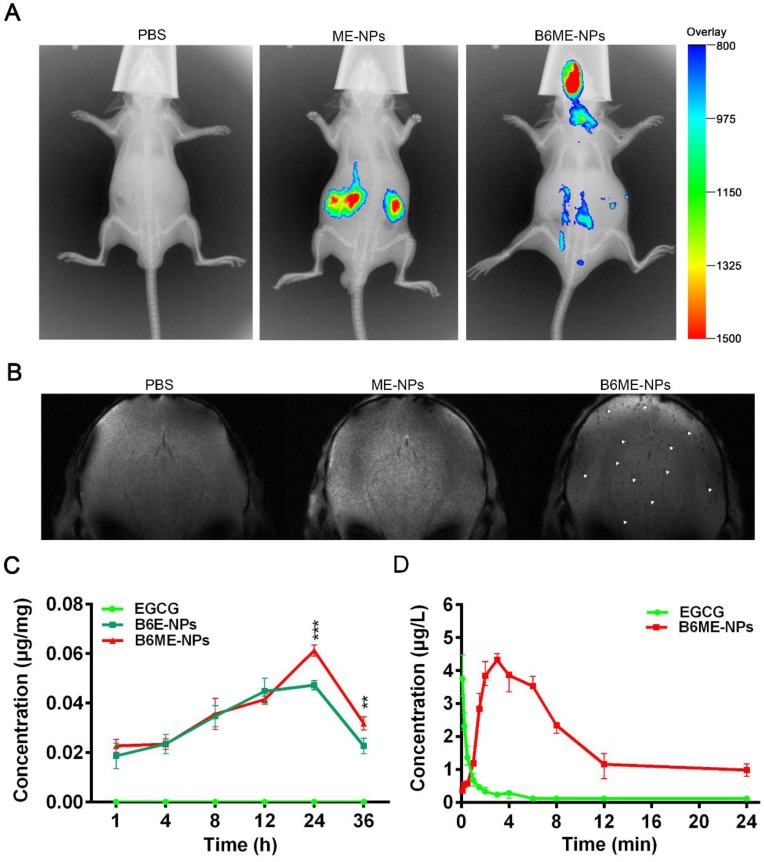
Figure 5.
Pharmacokinetics and accumulation of the traceable NPs in the SN region. (A) Representative fluorescence images of mice 24 h after i.v. treatment with different nanoparticles (PBS, Cy7-labeled ME-NPs and Cy7-labeled B6ME-NPs). (B) T2* MR images of mice brains 24 h after i.v. treatment with different nanoparticles (PBS, SPIONs-labeled ME-NPs and SPIONs-labeled B6ME-NPs). (C) SN concentration of EGCG from different nanoparticles at different time points post i.v. injection detected with liquid MS. (D) Plasma concentration of EGCG from different nanoparticles at different time points post i.v. injection detected with HPLC. Error bars represent mean ± SD (n = 3). *P < 0.05, **P < 0.01, ***P < 0.005.

