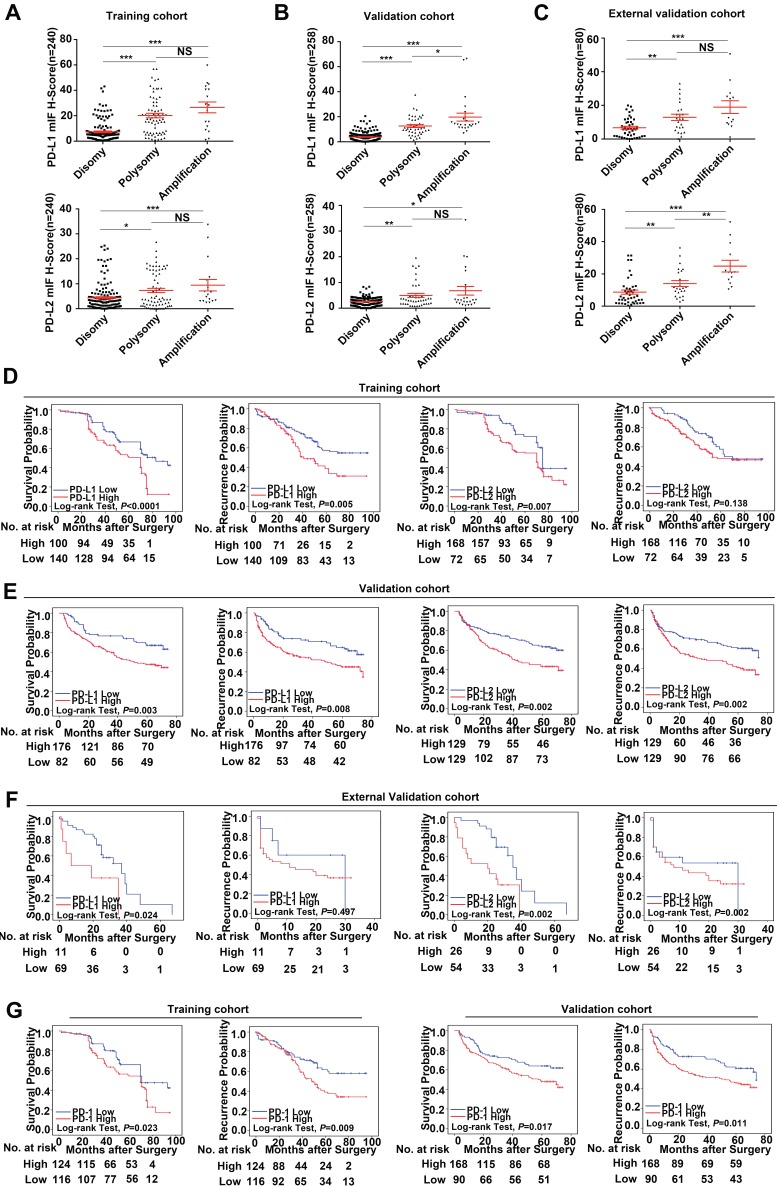
Figure 4.
Prognostic value and relationship with genetic alterations of PD-Ls/PD-1' protein expression. (A-C) The distribution of PD-Ls' translational level in each group of the 9p24.1 copy number alterations evaluated in training, validation and external validation cohorts. Data were presented as means ± SEM. *P < 0.05, **P < 0.01, and ***P < 0.001; two-tailed Student's t test. (D-F) Kaplan-Meier curves showing dismal survival and increased recurrence in patients with high PD-Ls expression (red) than those with low (blue) in three independent cohorts. (G) Kaplan-Meier curves showing poorer survival and increased recurrence in patients with high-dense PD-1+ immunocytes infiltration (red) than those with low-dense (blue) in training and validation cohorts. P values were determined by the log-rank test.

