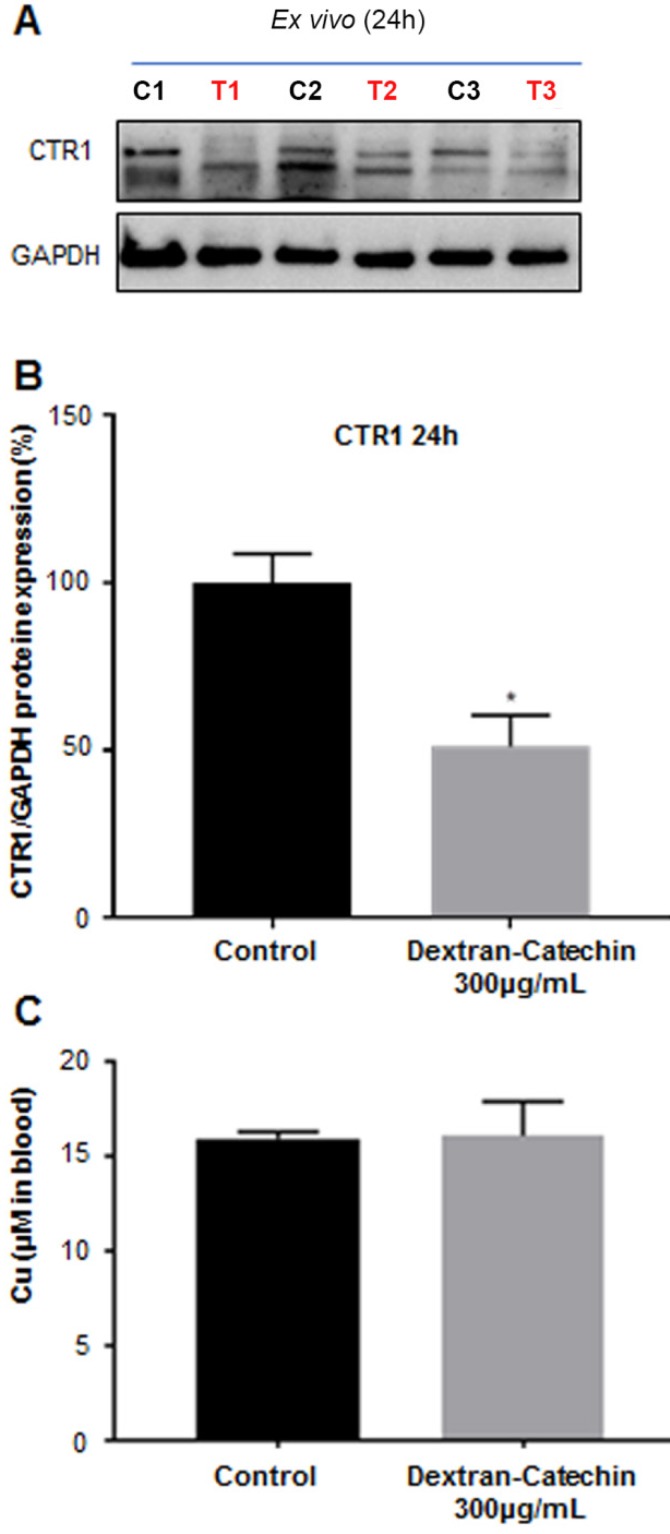
Figure 7.
CTR1 expression in the tumor tissues. Control (C1, C2, C3) and treated (T1, T2,T3) mice used in the PET imaging after 24h treatment (A); densitometry graph of Western blot data showing lower expression of CTR1 in the treated mice (B); blood levels of copper between the mice treated with Dextran-Catechin and the control group (C). Deviation calculated as SEM (*: p < 0.05).

