

Abstract
Individuals with the 16p11.2 BP4–BP5 copy number variant (CNV) exhibit a range of behavioral phenotypes that may include mild impairment in cognition and clinical diagnoses of autism spectrum disorder (ASD). To better understand auditory processing impairments in populations with this chromosomal variation, auditory evoked responses were examined in children with the 16p11.2 deletion, 16p11.2 duplication, and age-matched controls. Stimuli consisted of sinusoidal binaural tones presented passively while children underwent recording with magnetoencephalography (MEG). The primary indicator of auditory processing impairment was the latency of the ∼100-ms “M100” auditory response detected by MEG, with the 16p11.2 deletion population exhibiting profoundly delayed M100 latencies relative to controls. This delay remained even after controlling for potential confounds such as age and cognitive ability. No significant difference in M100 latency was observed between 16p11.2 duplication carriers and controls. Additionally, children meeting diagnostic criteria for ASD (16p11.2 deletion carriers) exhibited nonsignificant latency delays when compared with the corresponding CNV carriers not meeting criteria for ASD. Present results indicate that 16p11.2 deletion is associated with auditory processing delays analogous to (but substantially more pronounced than) those previously reported in “idiopathic” ASD.
Keywords: autism spectrum disorder, 16p112 deletion, 16p112 duplication, M100, magnetoencephalography
Introduction
Individuals with the deletion and duplication of the BP4–BP5 16p11.2 locus (chr16: 29.5–30.1 Mb) have varied behavioral phenotypes, including autism spectrum disorder (ASD) (Hanson et al. 2010; Qureshi et al. 2014), language impairment (Hanson et al. 2010; Shinawi et al. 2010; Zufferey et al. 2012), and developmental delays. Individuals with the 16p11.2 deletion and duplication, particularly duplication carriers, can also have a phenotype “within normal range” although they still tend to demonstrate significant impairments compared with family members who do not carry the deletion or duplication. Mouse models and human data demonstrate that the consequences of deletion of the 16p11.2 copy number variant (CNV) may be more severe than the duplication (Horev et al. 2011; Stefansson et al. 2014). The mechanistic linkage between this CNV and behavioral/clinical/diagnostic findings, however, remains elusive.
Studies have shown delayed auditory evoked neuromagnetic field components (M100: Roberts et al. 2010; M50: Roberts et al. 2013) in conditions such as ASD. Delayed evoked responses persist after variance associated with cognitive function (IQ) and language ability is considered. It has been speculated that delays in early auditory processing may reveal atypical development of auditory sensory cortex and/or thalamocortical connections (Roberts et al. 2009, 2013) and may functionally underlie subsequent higher-order neuronal dysfunction, leading to observed behavioral sequelae.
The purpose of this study is to assess the left and right superior temporal gyrus (STG) auditory evoked neuromagnetic field M100 component, detected by magnetoencephalography (MEG), in children with the 16p11.2 deletion and duplication in comparison with age-matched controls. Specifically, we test the hypothesis that STG M100 latency will be delayed in the genetically defined cohorts, in particular the deletion carriers. A hypothesis is that genes or other conserved elements in the 16p11.2 interval are necessary for generation of an age-appropriate M100 response (for example, by coding for synapse formation), and that, as with other CNVs, deletion carriers will be more severely impacted than duplication carriers. An alternative hypothesis predicts that the M100 response, as an indicator of atypical functional activity, more closely ties to phenotype and might thus be atypical in both deletion and duplication carriers with the same neurocognitive phenotype. Secondarily, given that the 16p11.2 deletion and duplication carriers share common breakpoints, it might be expected that observed measurement variability in the M100 will be reduced compared with measures in idiopathic (no known genetic, or other, etiology) ASD populations (Bijlsma et al. 2009). On the other hand, the variable clinical phenotypes associated with the 16p11.2 deletion and duplication (e.g., heterogeneous expression of ASD diagnosis, language impairment, and other phenotypes, ranging from mildly to severely impaired) might be expected to be associated with increased measurement variance of neuronal indices such as the M100.
A two-center multisite approach was adopted, as part of the broader Simons Variation in Individuals Project (Simons VIP; http://sfari.org/resources/simons-vip). The analysis examined the left and right STG auditory cortex M100 latencies in response to 200, 300, 500, and 1000 Hz sinusoidal tones. These analyses compared 16p11.2 deletions and duplications with age-matched controls and secondarily explored M100 latencies in the subset of 16p11.2 deletion and duplication carriers with ASD. We observe that children with the 16p11.2 deletion exhibit M100 delays relative to age-matched controls, of even greater magnitude than previously reported in idiopathic ASD compared with age-matched controls. Children with the 16p11.2 duplication exhibit M100 latencies not significantly different from the age-matched controls. Meeting diagnostic criteria for ASD in 16p11.2 CNV probands does not significantly further prolong latency.
Materials and Methods
Genetic Status Confirmation and Neuropsychological Assessment
16p11.2 deletion and duplication pediatric participants included individuals with the same recurrent of ∼600-kb deletion (chr16:29 652 999–30 199 351; hg19) without other pathogenic CNVs or known genetic diagnoses (Zufferey et al. 2012). Probands with the 16p11.2 deletion and duplication were identified through routine clinical chromosome microarrays and recruited through the Simons VIP Connect website to participate (Simons VIP Consortium 2012). Cascade genetic testing of family members using whole-genome high-resolution oligonucleotide arrays (Agilent 244k, G4411B, Agilent Technologies) determined whether the deletion or duplication was de novo or inherited to determine whether carriers had other clinically significant CNVs (which would be exclusionary) and to identify other 16p11.2 CNV carriers within the family (Baldwin et al. 2008). Age-matched controls underwent chromosome microarrays to rule out pathological CNVs at the 16p11.2 locus and throughout the genome. Eight (out of 35) 16p11.2 deletion participants and 3 (out of 16) 16p11.2 duplication participants met criteria for ASD as established by clinical impression using DSM-IV-TR criteria (American Psychiatric Association 2000).
Following screening, families participated in initial data collection at 1 of 4 Simons VIP phenotyping sites (Boston Children's Hospital, Baylor College of Medicine, University of Washington, Children's Hospital of Philadelphia) for a comprehensive and standardized multi-day evaluation. The study was approved by the Institutional Review Board at each participating institution; all participants provided informed consent prior to data collection. All diagnostic interviewing and cognitive testing was videotaped for later review. Standardization of measurements across sites included mandatory formalized, standardized training on all measures through in-person training sessions and webinars for all clinicians, cross-site reliability and maintenance through monthly clinician conference calls and periodic videotape review, and validation and diagnostic confirmation through data review and observation of video recorded sessions by independent consultants.
Experienced, licensed clinicians gave best-estimate, clinical DSM-IV-TR diagnoses using all information obtained during the research evaluation. Information was based on the standardized interview, questionnaire, and observation processes described below as well as results from standardized administration of the Diagnostic Interview Schedule for Children (Shaffer et al. 2000), SCL-90 (Derogatis 1977) and review of available medical records and prior testing. To capture the range of psychiatric presentation, exclusionary criteria for diagnoses were not considered (e.g., if a child met criteria for ADHD and ASD, both diagnoses were considered). Autism-specific diagnostic measures included the Autism Diagnostic Observation Scale (Lord et al. 2000) and the Autism Diagnostic Interview —Revised (Rutter et al. 2003); both measures were administered by research-reliable clinicians.
Participants were administered cognitive measures by experienced and licensed child psychologists via the standardization procedure described earlier. The Social Responsiveness Scale was used as a continuous measure of social and behavioral problems with high scores thought to correspond with greater likelihood of ASD (Constantino and Gruber 2005). Cognitive and language measures included: Differential Abilities Scale, Second Edition (Elliott 2007), Wechsler Abbreviated Scales of Intelligence (Wechsler 2003), the Clinical Evaluation of Language Fundamentals, Fourth Edition (Semel et al. 2003), and Comprehensive Test of Phonological Processing—Nonword Repetition subtest (Wagner et al. 1999). Standard scores were used, or when standard scores were not available, ratio intelligence quotient (IQ) scores were calculated, for Full Scale IQ, Verbal IQ (VIQ), and Nonverbal IQ (NVIQ). Control exclusion criteria included known neurologic or psychiatric diagnosis in the participant or any sibling, English as a second language, drug use, or incidental findings on MRI.
Based on geographical proximity, participants proceeded to MEG evaluation at 1 of 2 sites (Children's Hospital of Philadelphia, or University of California, San Francisco).
Participants
One hundred and thirty seven child participants (Children's Hospital of Philadelphia [CHOP]: 63, University of California, San Francisco [UCSF]: 74) were recruited (46 16p11.2 deletions, 25 duplications, and 66 controls). Of this initial pool, 19 were excluded based on eligibility criteria (e.g., psychological/neurological profile, drug use, and incidental findings from MRI). Of the residual pool of 118, who underwent MEG, 19 were found inevaluable due primarily to motion artifact (6 controls, 7 deletions, and 6 duplications). Thus, of the evaluable 99 participants (CHOP: 47, UCSF: 52), forty eight were age-matched controls, thirty-five 16p11.2 deletion carriers, and sixteen 16p11.2 duplication carriers. Of the age-matched controls, there were 19 females and 29 males, with 5 left-handed, 35 right-handed, and 8 ambidextrous (Oldfield 1971). Of the 16p11.2 deletion carriers, there were 15 females and 20 males, with 9 left-handed, 22 right-handed and 4 ambidextrous. Of the 16p11.2 duplication carriers, there were 6 females and 10 males, with 13 right-handed and 3 ambidextrous.
Stimuli, Procedure, and Delivery
Sinusoidal tones of 200, 300, 500, and 1000 Hz were passively presented. Tones were generated with LabView, sampled at 44.1 kHz with 16-bit resolution, and were of 400-ms duration with 10-ms linear onset and offset ramps. Prior to data acquisition, an auditory threshold test was conducted with 1000-Hz tones of 300-ms duration and 10-ms rise time, binaurally presented (starting at a comfortable hearing level) and decreased until reaching auditory threshold for each ear. The experimental tones were presented 45 dB above the threshold, with each tone presented 130 times. After completion of MEG scanning, structural MRIs were acquired using a 1-mm isotropic ME-MP-RAGE 3D T1 sequence (Siemens Trio™ 3T, Siemens Medical Solutions).
Experimental stimuli were presented using an Edirol UA-1x external D-to-A converter using E-Prime stimulus presentation software. Stimuli were delivered binaurally through a TDT SA1 power amp, a pair of PA5 attenuators and an MA5 microphone amplifier to Eartone ER3A transducers, and nonmagnetic air tubes and ear tip inserts. The ISI varied pseudo-randomly in the range 900–1100 ms.
MEG Recording
Data were acquired using either a 275-channel whole-head magnetometer (CHOP) or a 272-channel whole-head magnetometer (UCSF). Using anti-aliasing filters, recording bandwidth was DC-300 Hz, sampled at 1200 Hz/channel. Prior to scanning and data acquisition, 3 head-position indicator coils attached to the participant's scalp at nasion and left and right preauricular points provided continuous information on head position and orientation relative to the MEG sensors. Electrodes attached to the left and right clavicles and to the bipolar oblique (upper and lower left sites) recorded electrocardiogram (ECG) and electro-oculogram (EOG).
MEG Analysis
Source space analyses were implemented using BESA 5.2 (BESA Research). Prior to evoked response analysis (offline averaging, filtering, and baseline correction), the data were down-sampled to 500 Hz with a zero-phase high-pass filter (cutoff frequency: 166.7 Hz, −24 dB/octave slope). Eye-blink and heart artifact correction was implemented as described in Roberts et al. (2010). Epochs with artifacts other than blinks and heartbeats were rejected on the basis of amplitude and gradient criteria (amplitude >1200 fT/cm, and gradients >800 fT/cm/sample). For each condition (i.e., 200, 300, 500, and 1000 Hz tones), epochs from the continuous recording were defined 500 ms pre- and post-trigger onset.
The presence of a M100 response in the left and right STG was determined using a standard dipole source model that transformed the averaged and filtered MEG sensor data into brain space (MEG data co-registered to the Montreal Neurologic Institute averaged brain) using a dipole model with multiple sources (Scherg and von Cramon 1985; Scherg 1990; Scherg and Berg 1996). Specifically, the source model included left and right STG regional sources positioned at Heschl's gyrus and 9 fixed regional sources modeling brain background activity and acting as probe sources for additional activity. Each participant's eye-blink and heartbeat source vectors were included in the individual source models (Lins et al. 1993; Berg and Scherg 1994).
Auditory evoked responses were analyzed after applying 3 Butterworth filters: 1) a 1-Hz forward-phase high-pass (−6 dB/octave slope), 2) a zero-phase 40-Hz low-pass filter (−48 dB/octave slope), and 3) a 60-Hz notch filter (5 Hz width). For each tone, the evoked response was baseline corrected over the pretrigger interval. M100 latency peak for the left and right STG dipoles was determined based on the identification of an M100 in the sensor and source waveforms within an acceptable range (85–185 ms), resemblance to canonical M100 magnetic field topography and dipole goodness of fit. Adjustments (extensions) to the acceptable latency range were considered based on the age of the participants (younger participants typically have longer latencies; see Roberts et al. 2010; Roberts et al. 2013; Edgar et al. 2013). If a participant did not exhibit an auditory cortex magnetic field topography for a given condition, those observations were excluded from further analysis. Typically, the M100 either followed a detectable M50 or preceded a detectable M200 (or both). A total of 19 participants (2 controls, 17 deletions: 4 meeting ASD criteria) in the age range of 7.98–12.60 years had the M100 search latency window extended.
Statistical Analysis
Statistical analyses were performed using R 3.1.2 (R Core Team 2014). A given result was considered significant for 1) P < 0.05 (linear mixed models, Wald Type II chi-square tests, correlation tests, Tukey HSD) and 2) z > 2 (z-statistic, Tukey HSD). Results were visualized using the “ggplot2” package (Wickham 2009).
Linear mixed models (LMMs) with a dependent variable of M100 latency (ms) were performed with random effect of Subject, fixed effects of Case (16p11.2 deletion vs. 16p11.2 duplication vs. neurotypical control), Hemisphere, Stimulus Condition (200, 300, 500, and 1000 Hz), and Acquisition Site (CHOP vs. UCSF) with subject Age as a covariate and random slopes of Stimulus Condition and Hemisphere. LMMs were fit via maximum likelihood using the “lme4” package (Bates et al. 2014). Significance of the fixed effects was assessed using Wald Type II chi-square tests via the “car” package (Fox and Weisberg 2011), and multiple comparisons, significance of individual factor levels, and effect sizes were assessed using Tukey HSD via the “multcomp” package (Hothorn et al. 2008). The primary model evaluated was a main-effects model of Hemisphere + Stimulus Condition + Case + Age + Site + (Stimulus Condition + Hemisphere | Subject). Additional models with NVIQ and VIQ as a covariate were also assessed. Correlation tests (Spearman's rho) between neuropsychological assessment scores (VIQ, NVIQ, SRS total score, and CTOPP nonword repetition) and M100 latency were assessed in 16p11.2 deletion and duplication carriers. Comparisons of 16p11.2 deletion and duplication carriers meeting versus not meeting ASD diagnostic criteria were assessed using an LMM of Hemisphere + Stimulus Condition + ASD status + Age + Site; random effects structures were the same as in previous analyses.
Results
M100 Recording Success Rate
No significant difference in sensation level was observed between groups with mean differences of <5 dB (Χ2 = 3.810, df = 2, P = 0.148). For the participants not rejected from analysis on the grounds of excessive motion, evaluable auditory evoked responses from at least one stimulus condition (tone frequency × hemisphere) were obtained in all 35 of the participants with the 16p11.2 deletion and all 16 participants with the 16p11.2 duplication. In age-matched controls, evaluable data were obtained in 45 out of 48 participants. In terms of success eliciting at least one evaluable M100 response component, there was no significant difference between groups, even considering motion-based rejection: controls: 45/54, deletions: 35/42, duplications: 16/22, and Χ2 = 1.33 P = 0.51. Not all subjects had 8 evaluable responses (left, right hemisphere, 4 stimulus conditions). 266 evaluable responses (out of 384 possible) were observed in controls (69.3%), 203 (out of 280 possible) were observed in 16p11.2 deletion carriers (72.5%), and 65 (out of 128 possible) were observed in 16p11.2 duplications (50.8%). Analysis of deviance on the per-stimulus success rates indicated that the success rate for 16p11.2 duplication carriers was, however, less than that of 16p11.2 deletion carriers (estimate = 0.281, SE = 0.222, z = −4.231, P < 1e − 04) or age-matched controls (estimate = 0.314, SE = 0.209, z = −3.748, P < 0.001). Success rates for 16p11.2 deletion carriers versus age-matched controls did not differ (estimate = 0.539, SE = 0.174, z = 0.902, P = 0.637). Summaries of age and psychological score distributions for participants with evaluable data are shown in Table 1.
Table 1.
Participants with evaluable data distribution summary
| Age-matched controls | 16p11.2 deletion carriers | 16p11.2 duplication carriers | |
|---|---|---|---|
| Age range (years)a | 7.31–17.15 | 7.98–17.03 | 7.38–16.92 |
| Mean age (years) | 12.82 ± 2.56 | 11.32 ± .2.65 | 11.45 ± 2.41 |
| N (evaluable) | 45 | 35 | 16 |
| NVIQ | 105.73 ± 11.88 | 90.09 ± 15.07 | 83.06 ± 10.68 |
| VIQ | 107.24 ± 13.72 | 85.37 ± 17.05 | 91.69 ± 14.09 |
| CELF-4 | 106.22 ± 11.22 | 75.81 ± 20.80 | 84.62 ± 13.18 |
| SRS | 16.68 ± 11.89 | 71.51 ± 34.38 | 72.06 ± 41.22 |
| CTOPP nonword repetition | 9.23 ± 1.95 | 5.64 ± 2.64 | 7.64 ± 1.45 |
aSummary of age and psychological score distributions for each case: participants with evaluable M100 data. Values are means ± 1 SD. For participants with evaluable M100 data (i.e., at least 1 observed M100 out of 8 measurements), there was a significant difference in the age distributions (F2,93 = 3.88, P = 0.024) between cases; this was due to the mean age of the controls being higher than the population mean (estimate = 0.776, SE = 0.279, t = 2.781, P = 0.017). However, the age distributions of each population overlapped within their mean and 1 SD of each other, indicating the distributions were comparable. Age was nevertheless considered as a covariate in all analyses. There were also significant differences in the NVIQ (F2,89 = 22.96, P = 9.103e − 09), VIQ (F2,89 = 20.59, P = 4.485e − 08), CELF-4 (F2,82 = 34.92, P = 1.068e − 11), SRS (F2,84 = 43.97, P = 5.235e − 14), and CTOPP (F2,84 = 24.464, P = 4.245e − 09) distributions.
M100 Latency Effects
Figure 1 illustrates a typical auditory evoked response from representative individuals in the control, 16p11.2 deletion, and 16p11.2 duplication groups using the FieldTrip package (Oostenveld et al. 2011). Note that whereas source modeled waveform morphology is similar across participants, the latency of the peak “M100” evoked response differs, later in the 16p11.2 deletion (compared with control) and similar in the 16p11.2 duplication (compared with control).
Figure 1.

Representative control, 16p11.2 deletion, and 16p11.2 duplication auditory response profiles. Artifact-corrected source waveforms to a 1000-Hz tone in the RH for a control (left column, 11.78 y.o.), 16p11.2 deletion carrier (middle column, 9.62 y.o.), and 16p11.2 duplication carrier (right column, 13.98 y.o.). All participants are within 1 SD of the mean population age. Source time courses are in the top row and source-sink distribution in the bottom row (source = red; sink = blue). M100 latency for the 16p11.2 deletion carrier is 152 ms, that for the control is 112 ms, and that for the 16p11.2 duplication carrier is 108 ms. From the visualization, the M100 peak is clearly seen based on the magnetic field deflections and the canonical source-sink distribution; there is more lateralization present in the control and as such, the corresponding LH source-sink distribution is not displayed.
Within each group, M100 latency was negatively associated with age (decreasing latency with increasing age), as has been shown before (Paetau et al. 1995; Roberts et al. 2009; Edgar et al. 2014). Figure 2a shows associations between M100 latency versus age for each group. Although regression slopes do not differ (−3.9 ± 0.8 ms/year control vs. −5.6 ± 1.5 ms/year 16p11.2 deletion vs. −2.4 ± 1.4 ms/year 16p11.2 duplication; F2,93 = 1.197, P = 0.307), there is a clear shift between the regression lines, indicating a longer latency in the 16p11.2 deletion group and suggesting an earlier, although nonsignificant, latency (∼5 ms) in 16p11.2 duplications versus controls. Whereas the regression lines in Figure 2a reflect an effective M100 latency derived from the responses from both hemispheres to individual tones of 4 different frequencies, the robust persistence of the general trend of significantly increased latency in deletion carriers is shown in Figure 2b,c, breaking down fixed effects of stimulus frequency (Fig. 2b) and hemisphere (Fig. 2c). For each stimulus type and for both hemispheres, the observed group differences between controls, 16p11.2 deletion, and duplication carriers are recapitulated. Case differences are further explained in Table 2.
Figure 2.

Latency versus age regression, stimulus condition, and hemispheric means for each case. Age-matched controls are delineated in gray circles with a solid outline, 16p11.2 deletion carriers by orange triangles with a dashed outline, and 16p11.2 duplication carriers by light blue squares with a dotted outline. (a) For all 3 cases, there is an inverse relationship between M100 latency (across stimulus conditions and hemispheres) and age, with the slopes between the cases not significantly different (F2, 93 = 1.197, P = 0.307). (b) M100 latency for each case and stimulus condition. For each stimulus condition, 16p11.2 deletion carriers exhibit a delay in M100 latency relative to age-matched controls, whereas 16p11.2 duplication carrier latencies are not significantly different. (c) As with the mean M100 latencies in (a) and for each stimulus condition (b), similar patterns of M100 latency delay are present in 16p11.2 deletion carriers for each hemisphere.
Table 2.
Least-squares means for each case
| Meana | Age-matched controls | 16p11.2 deletion carriers | 16p11.2 duplication carriers |
|---|---|---|---|
| Overall (ms) | 127.2 ± 3.1 | 149.0 ± 3.6 | 120.9 ± 5.3 |
| LH (ms) | 136.7 ± 3.7 | 155.3 ± 4.0 | 126.5 ± 6.6 |
| RH (ms) | 118.6 ± 3.3 | 143.0 ± 4.1 | 115.7 ± 5.8 |
aLeast-squares means for age-matched controls, 16p11.2 deletion, and 16p11.2 duplication carriers: overall (modeling factors of Hemisphere, Stimulus Condition, Case, Site, and covarying with Age) and within each hemisphere (modeling Stimulus Condition, Case, Site, and covarying with Age), 16p11.2 deletion carriers exhibit an approximately 21-ms delay in M100 compared with age-matched controls. The difference between 16p11.2 deletion carriers and controls was significant overall and in each hemisphere (LH: estimate = 18.4 ms, SE = 5.5, z = 3.339, P = 0.002; RH: estimate = 23.4 ms, SE = 5.5, z = 4.293, P < 0.001).
Age-covaried LMM indicated significant main effects for hemisphere (L vs. R; Χ2 = 40.477, df = 1, P = 1.990e − 10), stimulus condition (200 vs. 300 vs. 500 vs. 1000 Hz; Χ2 = 162.930, df = 3, P < 2.2e − 16), and case (16p11.2 deletion vs. 16p11.2 duplication vs. control; Χ2 = 32.265, df = 2, P = 9.857e − 08). In particular, responses were earlier in the right than left STG (estimate = −14.6 ms, SE = 2.3, z = −6.362, P = 1.990e − 10) and earlier to higher frequencies (500 and 1000 Hz) than lower frequencies (minimum estimate = −4.3 ms, SE = 1.1, z = −4.047, P < 0.001).
Whereas 16p11.2 deletion M100 latencies were longer than age-matched controls (estimate = 20.9 ms, SE = 4.3, z = 4.822, P < 1e−04), responses in 16p11.2 duplication carriers were not different from controls, although their mean M100 latency value was slightly earlier (estimate = −5.4 ms, SE = 5.6, z = −0.978, P = 0.588). There was no effect of sex (Χ2 = 0.198, df = 1, P = 0.657). No effect of nonverbal IQ (NVIQ) or verbal IQ (VIQ) as a covariate was observed (NVIQ: Χ2 = 0.334, df = 1, P = 0.563; VIQ: Χ2 = 0.281, df = 1, P = 0.596). There was no effect of recording site (CHOP vs. UCSF; Χ2 = 1.484, df = 1, P = 0.223). The slight latency difference (5.4 ms; 4.4 SE) is likely attributed to technical or population sampling differences (and site was nonetheless included in all analyses as a fixed effect). Effect sizes and Tukey HSD are summarized in Table 3.
Table 3.
Effect sizes estimates and Tukey HSD for case comparisons
| Comparisona | Estimate (ms) | SE | z | P |
|---|---|---|---|---|
| deletion–control | 20.9 | 4.3 | 4.822 | <1 e −04 |
| duplication–control | −5.4 | 5.6 | −0.978 | 0.588 |
| duplication–deletion | −26.4 | 5.6 | −4.682 | <1 e −04 |
aEffect size estimate and Tukey HSD for M100 latency between each Case. 16p11.2 deletion carriers exhibit delayed latencies relative to age-matched controls and 16p11.2 duplication carriers, whereas latency differences between 16p11.2 duplication carriers and age-matched controls are not significantly different, although the distributions are significantly shifted toward shorter latency for 16p11.2 duplication carriers.
Figure 3 summarizes the effect of group, showing least-squares mean M100 latencies (after modeling fixed effects of hemisphere, condition, acquisition site, and covarying age and accounting for individual subject differences in hemispheric processing and response to the stimulus conditions as random effects). A pronounced prolongation of M100 latency is observed in the 16p11.2 deletion group. There is no difference in mean M100 latency between 16p11.2 duplication carriers and age-matched controls. M100 latency distribution curves for each population (Fig. 3b) show that the distributions do, however, differ significantly (Kolmogorov–Smirnov: min. D = 0.512, P = 2.578e − 12), with the 16p11.2 duplication cohort shifted toward earlier latencies. Hence, the approximately 5-ms earlier latency observed in the 16p11.2 duplication group mean may indeed represent a nonsignificant trend, with statistical significance likely not achieved because of the combination of small effect size, high variance, and low sample number in this cohort (evaluable n = 16). A power calculation estimate using a difference in means of 5.4 ms, a pooled SD of 7.78 ms and requiring 80% power at an alpha level of 0.05, suggests an evaluable sample size of at least 33 would be required to resolve group differences between the 16p11.2 duplication and control groups. Nonetheless, our interpretation of the mean and distribution data is that of a nonsignificant trend, unresolvable in the present study.
Figure 3.
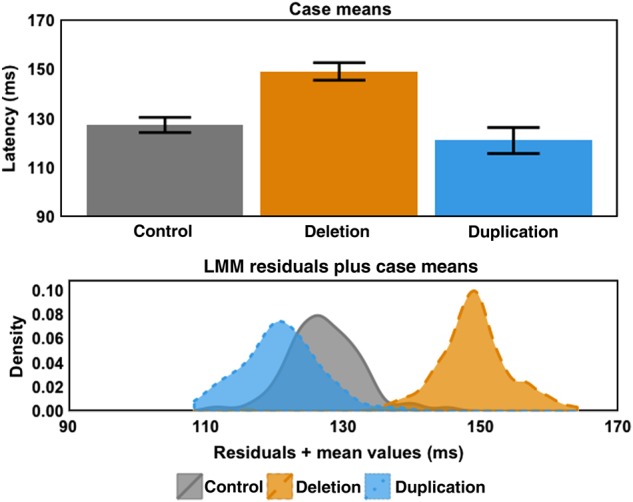
M100 least-squares means and LMM residuals separated by case means. (Upper panel) Least-squares means ± one standard error derived from main-effects model of Hemisphere + Stimulus Condition + Case + Age + Site + (Stimulus Condition + Hemisphere | Subject). Coloring and line conventions are the same as in Figure 2. Case means illustrate 1) the large delay exhibited by 16p11.2 deletion carriers (∼21 ms) and 2) that 16p11.2 duplication carrier latency means are not significantly different from controls. (Lower panel) Kernel density estimates (Gaussian window, 512 points, bandwidth calculated using Silverman's rule of thumb) of residuals plus case means for each case. This visualization demonstrates 1) the separation of 16p11.2 deletion M100 latencies from controls and 2) the similar residual variance in all subpopulations. A Brown–Forsythe test for homogeneity of variance did not yield a significant difference in residual variance between each of the populations (F2,531 = 0.192, P = 0.825) but Kolmogorov–Smirnov tests on these distributions indicated the distributions were significantly different (min. D = 0.512, P = 2.578e − 12), suggesting that the apparent shift toward a shorter latency in 16p11.2 duplication carriers represents a trend rendered nonsignificant by sample size.
Prior reports have indicated a delay in M100 latency as a characteristic of ASD and a high prevalence of ASD in individuals with the 16p11.2 deletion and duplication. In this sample, 8 out of the 35 evaluable (22.9%) 16p11.2 deletion carriers met diagnostic criteria for ASD; 3 of the 16 evaluable (18.8%) individuals with 16p11.2 duplications met ASD criteria. These proportions did not, however, significantly differ (Χ2 = 0.110, P = 0.741). Within the deletion cohort, comparison of individuals with and without ASD revealed a nonsignificant 8-ms latency prolongation associated with ASD (estimate = 8.3 ms, SE = 7.0, z = 0.191, P = 0.740). The ASD sample size of 3 prohibits statistical analysis within the 16p11.2 duplication cohort.
For each group, collapsing across individuals with and without ASD, association between least-squares mean M100 latency, and the following psychological scores were examined for NVIQ, SRS, CELF-4 core language index, and CTOPP nonword repetition subtest. Analyses revealed no within group associations (min. S = 9285.475, ρ = 0.248, P = 0.114) but confirmed overall latency prolongation in the 16p11.2 deletion group.
Discussion
The main result of this study is a pronounced (∼20 ms) delay in the latency of the M100 component of the auditory evoked response in children with the 16p11.2 BP4–BP5 deletion. There was no significant difference in M100 latency in 16p11.2 duplications versus controls. Main effects of stimulus type and hemisphere were observed, along with the dependency of M100 with age, consistent with previous reports. Of note, the overall effect of (∼20%) increased M100 latency in 16p11.2 deletion carriers transcended each of these factors.
However, the observed nonsignificant shortening of latency in 16p11.2 duplications (as opposed to prolongation in 16p11.2 deletions) is not inconsistent with other gene-dosage-opposing effects that have been reported. For example, 16p11.2 gene dosage has opposing effects on head circumference, with macrocephaly in 16p11.2 deletion carriers and microcephaly in 16p11.2 duplication carriers (Shinawi et al. 2010), opposing effects on brain volume by structural MRI (Qureshi et al. 2014), and opposing effects on microstructure assessed by diffusion MRI (Owen et al. 2014). A speculative interpretation is that one or more genes in the 16p11.2 region may be necessary to ensure a “typical” M100; haploinsufficiency of such genes or conserved elements may lead to a delayed M100 evoked response; excess dosage of such genetic material may have no additional impact or may lead to a slight facilitation of the M100 evoked response component (with the degree of facilitation limited and of modest amount). This hypothesis, which requires further investigation, nonetheless offers a putative biological mechanism linking genetic and neurophysiological differences.
Additionally, there was no significant difference in M100 latency between 16p11.2 deletion carriers who met (vs. not meeting) ASD diagnostic criteria. We speculate that the additional, although nonsignificant, latency prolongation associated with ASD diagnosis may arise from additional distinct and additive factors acting within the setting of 16p11.2 CNV sensitization, perhaps akin to those factors observed in idiopathic ASD. Previous studies have hypothesized biophysical mechanisms underlying M100 latency delays associated with maturation of thalamocortical white matter pathways or synaptic transmission. Genetic contributions to these mechanisms as well as association between atypical development in ASD and these mechanisms remain to be elucidated.
A limitation, and topic for further exploration, was the difference in evaluable data success rates between groups (lower in the 16p11.2 duplication group). Data were rendered nonevaluable primarily for reasons of compliance (movement) and low signal-to-noise ratio. Not only does this point to intrinsic differences between the groups, but it also limits our interpretation to the subset of 16p11.2 duplication carriers with evaluable data and thus constitutes a form of potential ascertainment bias.
The lack of association between M100 latency and the clinical/behavioral/neuropsychological measures (i.e., NVIQ, SRS, CELF-4, and CTOPP), along with the distinct difference in M100 latency between 16p11.2 deletion and duplication carriers (despite clinical/behavioral deficits in both groups), suggests that M100 latency is not directly predictive of clinical/behavioral outcome. Rather, as discussed earlier, the influence of 16p11.2 copy number on M100 latency offers a speculative link between genetics and neurophysiology, perhaps partially bridging the chasm of gene to behavior. Although not explicitly tested in this study, it is notable that the M100 latency residual distributions (after considering effects of age, stimulus, hemisphere, case, and site) have a standard deviation of the order of ∼5.6 ms, quite similar to that previously observed in typical controls and idiopathic ASD, and thus reflecting a similar degree of variability. This suggests, provocatively, that reducing genetic heterogeneity (at least to the extent achievable by considering a common CNV) has little effect on the variability of the neurophysiologic phenotype.
In summary, deletion of the 16p11.2 BP4–BP5 region had a profound effect on M100 latency with mean delays of approximately 20 ms. Duplication of the same region showed no significant difference in M100 latency. The influence of ASD diagnosis on M100 latency was marginal and nonsignificant. No association between M100 latency and clinical/behavioral/neuropsychological assessments was observed. Overall, results provide support for a gene–neurophysiology association with an observable gene-dosage effect and implicate the 16p11.2 BP4–BP5 locus as involved in auditory evoked M100 response component generation.
Funding
This work was supported by a grant from the Simons Foundation (SFARI #216074 and #251203 to T.R.) and is submitted on behalf of the Simons Variation in Individuals Project (Simons VIP) investigators.
Notes
We are grateful to all of the families at the participating Simons Variation in Individuals Project (Simons VIP) sites, as well as the Simons VIP Consortium. We appreciate obtaining access to phenotypic data on SFARI Base. Approved researchers can obtain the Simons VIP population dataset described in this study by contacting the Simons Foundation Autism Research Initiative. The authors thank John W. Dell, Rachel Golembski, Peter V. Lam, Polina Bukshpun, Tony Thieu, and Nick Pojman for assistance in participant scanning. Conflict of Interest: Dr Spiro and Dr Chung are employees of the Simons Foundation. Dr Roberts has a consulting agreement with Prism Clinical Imaging and has received speaking honoraria from Siemens Medical Solutions and Elekta Oy. Dr Sherr is on the advisory board of InVitae and consults for Personalis. Dr Roberts thanks the Oberkircher family for the Oberkircher Family Chair in Pediatric Radiology.
References
- American Psychiatric Association AP. 2000. Diagnostic and statistical manual of mental disorders: DSM-IV-TR®. Arlington, VA: American Psychiatric Pub. [Google Scholar]
- Baldwin EL, Lee J-Y, Blake DM, Bunke BP, Alexander CR, Kogan AL, Ledbetter DH, Martin CL. 2008. Enhanced detection of clinically relevant genomic imbalances using a targeted plus whole genome oligonucleotide microarray. Genet Med. 10:415–429. [DOI] [PubMed] [Google Scholar]
- Bates D, Maechler M, Bolker B, Walker S. 2014. lme4: Linear mixed-effects models using Eigen and S4. R package version 1.0–6. Available from: URL http://CRAN.R-project.org/package=lme4.
- Berg P, Scherg M. 1994. A multiple source approach to the correction of eye artifacts. Electroencephalogr Clin Neurophysiol. 90:229–241. [DOI] [PubMed] [Google Scholar]
- Bijlsma EK, Gijsbers ACJ, Schuurs-Hoeijmakers JHM, Van Haeringen A, Fransen Van De Putte DE, Anderlid B-M, Lundin J, Lapunzina P, Perez Jurado LA et al. . 2009. Extending the phenotype of recurrent rearrangements of 16p11. 2: deletions in mentally retarded patients without autism and in normal individuals. Eur J Med Genet. 52:77–87. [DOI] [PubMed] [Google Scholar]
- Constantino J, Gruber CP. 2005. Social Responsiveness Scale. Los Angeles, CA: Western Psychological Services. [Google Scholar]
- Derogatis LR. 1977. SCL-90. Adm scoring Proced manual-I R version other instruments Psychopathol Rat Scales Ser Chicago Johns Hopkins Univ Sch Med.
- Edgar JC, Khan SY, Blaskey L, Chow VY, Rey M, Gaetz W, Cannon KM, Monroe JF, Cornew L, Qasmieh S. 2013. Neuromagnetic oscillations predict evoked-response latency delays and core language deficits in autism spectrum disorders. J Autism Dev Disord. [Epub ahead of print]. [DOI] [PMC free article] [PubMed] [Google Scholar]
- Edgar JC, Lanza MR, Daina AB, Monroe JF, Khan SY, Blaskey L, Cannon KM, Jenkins J III, Qasmieh S, Levy SE. 2014. Missing and delayed auditory responses in young and older children with autism spectrum disorders. Front Hum Neurosci. 8:417. [DOI] [PMC free article] [PubMed] [Google Scholar]
- Elliott CD. 2007. Differential Ability Scales-ll. San Antonio, TX: Pearson. [Google Scholar]
- Fox J, Weisberg S. 2011. An R companion to applied regression, Second Edition. 2nd. ed Thousand Oaks, CA: Sage. [Google Scholar]
- Hanson E, Nasir RH, Fong A, Lian A, Hundley R, Shen Y, Wu B-L, Holm IA, Miller DT. 2010. Cognitive and behavioral characterization of 16p11. 2 deletion syndrome. J Dev Behav Pediatr. 31:649–657. [DOI] [PubMed] [Google Scholar]
- Horev G, Ellegood J, Lerch JP, Son Y-EE, Muthuswamy L, Vogel H, Krieger AM, Buja A, Henkelman RM, Wigler M. 2011. Dosage-dependent phenotypes in models of 16p11. 2 lesions found in autism. Proc Natl Acad Sci USA. 108:17076–17081. [DOI] [PMC free article] [PubMed] [Google Scholar]
- Hothorn T, Bretz F, Westfall P. 2008. Simultaneous inference in general parametric models. Biom J. 50:346–363. [DOI] [PubMed] [Google Scholar]
- Lins OG, Picton TW, Berg P, Scherg M. 1993. Ocular artifacts in recording EEGs and event-related potentials. II: Source dipoles and source components. Brain Topogr. 6:65–78. [DOI] [PubMed] [Google Scholar]
- Lord C, Risi S, Lambrecht L, Cook EH, Leventhal BL, DiLavore PC, Pickles A, Rutter M. 2000. The autism diagnostic observation schedule-generic: a standard measure of social and communication deficits associated with the spectrum of autism. J Autism Dev Disord. 30:205–223. [PubMed] [Google Scholar]
- Oldfield RC. 1971. The assessment and analysis of handedness: the Edinburgh inventory. Neuropsychologia. 9:97–113. [DOI] [PubMed] [Google Scholar]
- Oostenveld R, Fries P, Maris E, Schoffelen JM. 2011. FieldTrip: open source software for advanced analysis of MEG, EEG, and invasive electrophysiological data. Comput Intell Neurosci. 2011:156869. [DOI] [PMC free article] [PubMed] [Google Scholar]
- Owen JP, Chang YS, Pojman NJ, Bukshpun P, Wakahiro MLJ, Marco EJ, Berman JI, Spiro JE, Chung WK, Buckner RL et al. . 2014. Aberrant white matter microstructure in children with 16p11. 2 deletions. J Neurosci. 34:6214–6223. [DOI] [PMC free article] [PubMed] [Google Scholar]
- Paetau R, Ahonen A, Salonen O, Sams M. 1995. Auditory evoked magnetic fields to tones and pseudowords in healthy children and adults. J Clin Neurophysiol. 12:177–185. [DOI] [PubMed] [Google Scholar]
- Qureshi AY, Mueller S, Snyder AZ, Mukherjee P, Berman JI, Roberts TPL, Nagarajan SS, Spiro JE, Chung WK, Sherr EH. 2014. Opposing Brain Differences in 16p11. 2 Deletion and Duplication Carriers. J Neurosci. 34:11199–11211. [DOI] [PMC free article] [PubMed] [Google Scholar]
- R Core Team. 2014. R: A Language and Environment for Statistical Computing. Vienna, Austria: R Foundation for Statistical Computing. [Google Scholar]
- Roberts TPL, Khan SY, Blaskey L, Dell J, Levy SE, Zarnow DM, Edgar JC. 2009. Developmental correlation of diffusion anisotropy with auditory-evoked response. Neuroreport. 20:1586–1591. [DOI] [PubMed] [Google Scholar]
- Roberts TP, Khan SY, Rey M, Monroe JF, Cannon K, Blaskey L, Woldoff S, Qasmieh S, Gandal M, Schmidt GL et al. . 2010. MEG detection of delayed auditory evoked responses in autism spectrum disorders: towards an imaging biomarker for autism. Autism Res. 3:8–18. [DOI] [PMC free article] [PubMed] [Google Scholar]
- Roberts TPL, Lanza MR, Dell J, Qasmieh S, Hines K, Blaskey L, Zarnow DM, Levy SE, Edgar JC, Berman JI. 2013. Maturational differences in thalamocortical white matter microstructure and auditory evoked response latencies in autism spectrum disorders. Brain Res. 1537:79–85. [DOI] [PMC free article] [PubMed] [Google Scholar]
- Rutter M, Le Couteur A, Lord C. 2003. Autism Diagnostic Interview-Revised. Los Angeles, CA: West Psychol Serv. [Google Scholar]
- Scherg M. 1990. Fundamentals of Dipole Source Potential Analysis, in Auditory Evoked Magnetic Fields and Electric Potentials. Advances in Audiology. Basel, Switzerland: Karger. [Google Scholar]
- Scherg M, Berg P. 1996. New concepts of brain source imaging and localization. Electroencephalogr Clin Neurophysiol Suppl. 46:127–137. [PubMed] [Google Scholar]
- Scherg M, von Cramon D. 1985. A new interpretation of the generators of BAEP waves I-V: results of a spatio-temporal dipole model. Electroencephalogr Clin Neurophysiol. 62:290–299. [DOI] [PubMed] [Google Scholar]
- Semel EM, Wiig EH, Sicord W. 2003. Clinical Evaluation of Language Fundamentals (CELF-4). San Antonio, TX: The Psychological Corporation. [Google Scholar]
- Shaffer D, Fisher P, Lucas CP, Dulcan MK, Schwab-Stone ME. 2000. NIMH Diagnostic Interview Schedule for Children Version IV (NIMH DISC-IV): description, differences from previous versions, and reliability of some common diagnoses. J Am Acad Child Adolesc Psychiatry. 39:28–38. [DOI] [PubMed] [Google Scholar]
- Shinawi M, Liu P, Kang S-HL, Shen J, Belmont JW, Scott DA, Probst FJ, Craigen WJ, Graham BH, Pursley A. 2010. Recurrent reciprocal 16p11. 2 rearrangements associated with global developmental delay, behavioural problems, dysmorphism, epilepsy, and abnormal head size. J Med Genet. 47:332–341. [DOI] [PMC free article] [PubMed] [Google Scholar]
- Simons VIP Consortium. 2012. Simons variation in individuals project (Simons VIP): a genetics-first approach to studying autism spectrum and related neurodevelopmental disorders. Neuron. 73:1063–1067. [DOI] [PubMed] [Google Scholar]
- Stefansson H, Meyer-Lindenberg A, Steinberg S, Magnusdottir B, Morgen K, Arnarsdottir S, Bjornsdottir G, Walters GB, Jonsdottir GA, Doyle OM. 2014. CNVs conferring risk of autism or schizophrenia affect cognition in controls. Nature. 505:361–366. [DOI] [PubMed] [Google Scholar]
- Wagner RK, Torgesen JK, Rashotte CA. 1999. Comprehensive Test of Phonological Processing. Austin, TX: CTOPP. ASHA. [Google Scholar]
- Wechsler D. 2003. Wechsler Intelligence Scale for Children. San Antonio, TX: The Psychological Corporation. [Google Scholar]
- Wickham H. 2009. Ggplot2: Elegant Graphics for Data Analysis, Use R! New York , London: Springer Science + Business Media. [Google Scholar]
- Zufferey F, Sherr EH, Beckmann ND, Hanson E, Maillard AM, Hippolyte L, Macé A, Ferrari C, Kutalik Z, Andrieux J. 2012. A 600 kb deletion syndrome at 16p11. 2 leads to energy mbalance and neuropsychiatric disorders. J Med Genet. 49:660–668. [DOI] [PMC free article] [PubMed] [Google Scholar]