
Figure 4. Characterization of activator binding site mutants.
(a) Perturbation of the activator binding site leads to loss of responsiveness to compound 1, although the G71I and Y51S/G71I variants are themselves stabilized compared to WT LCAT. LPLA2 variants, however, do not bind to 1, and chimeric swaps are destabilized. Data are mean ± s.e.m. of at least three independent experiments performed in duplicate. ****p<0.0001 by one-way analysis of variance followed by Tukey’s multiple comparisons post-test. Each protein without ligand was compared to that same variant with compound 1, and WT LCAT was compared to each LCAT variant. Non-significant comparisons are not shown. (b) Plot used to determine kon, koff, and hence Kd from BLI data for LCAT binding to HDL. Data are mean ± s.e.m. of three independent experiments. (c) DHE acyltransferase assay with peptide HDLs comparing the absence (solid lines) and presence (dashed lines) of 5 μM compound 2, which was used in this assay instead of 1 due to its lower background fluorescence. Data are mean ± s.e.m. of three independent experiments performed in triplicate. (d) Titration of compound 1 in the MUP hydrolysis assay. Data were normalized to basal activity of 100% for each variant to give percent activation. Data are mean ± s.e.m. of three independent experiments. (e) Titration of compound 2 in the DHE acyltransferase assay. Data are mean ± s.e.m. of three independent experiments performed in triplicate.
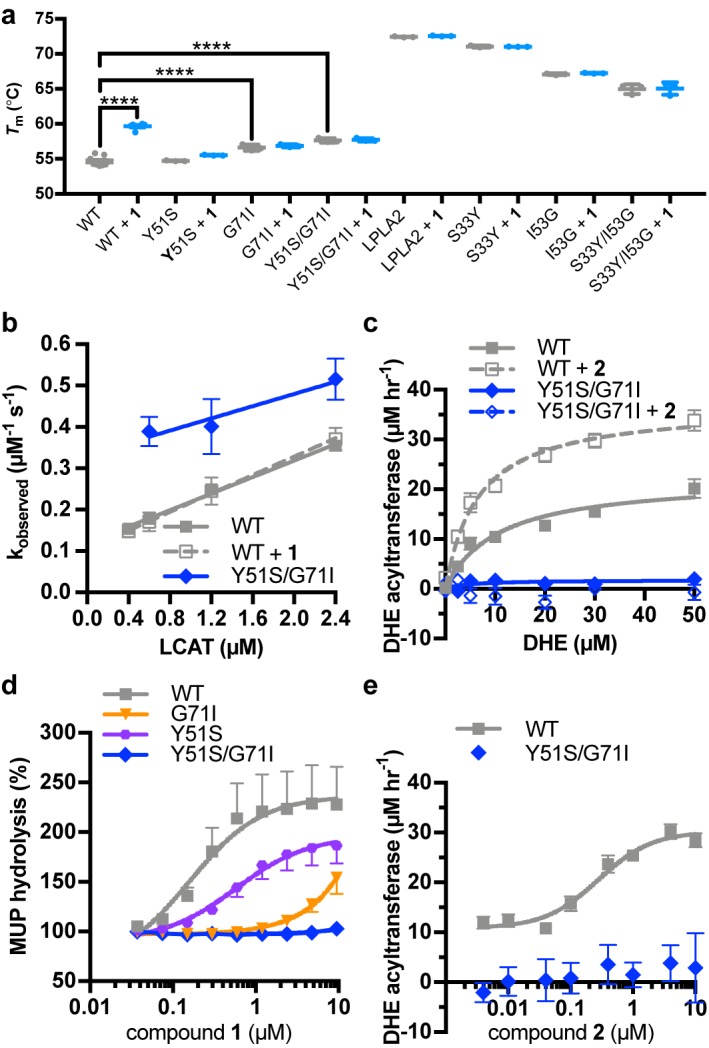
Figure 4—figure supplement 1. Biochemical characterization of LCAT variants.

Figure 4—figure supplement 2. Representative BLI data for LCAT-Arg244 variants.
