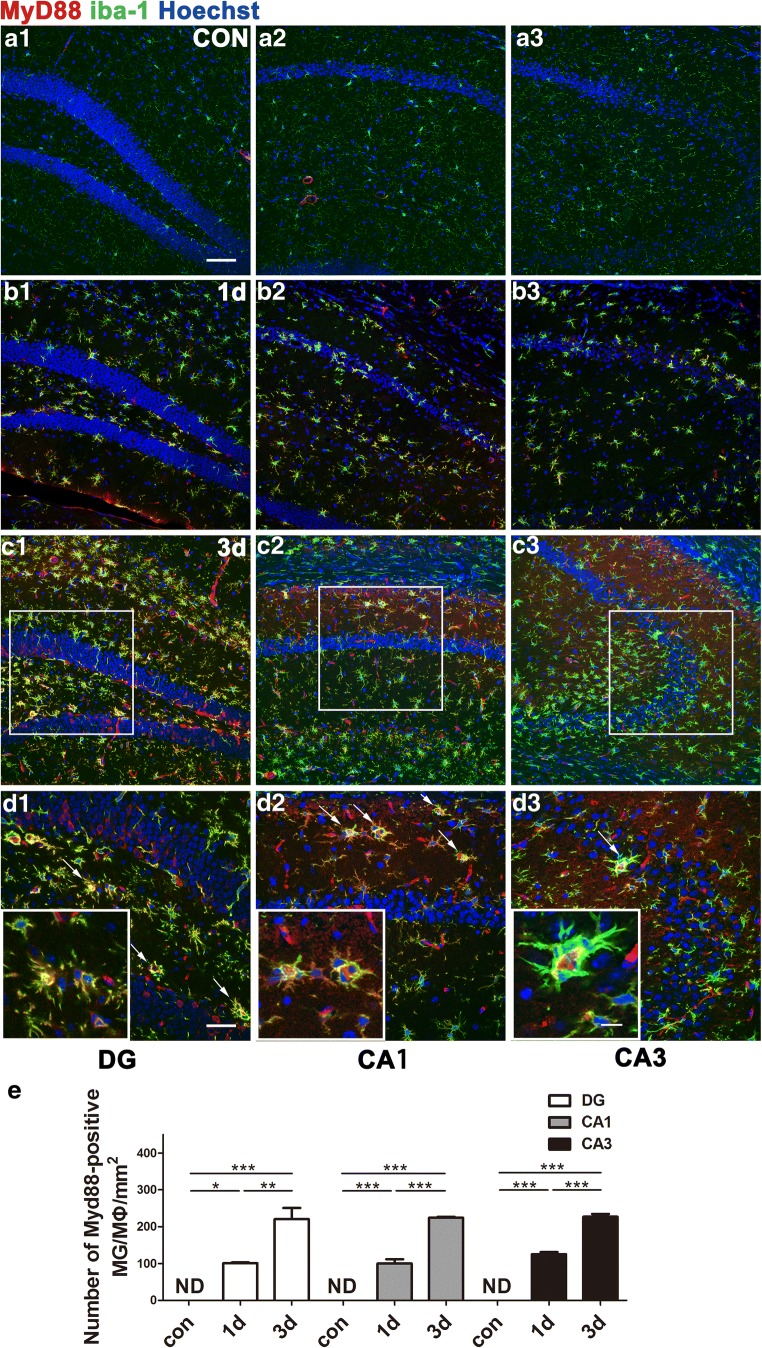
Fig. 2.
Representative pictures of MyD88-immunoreactive MG/MΦ and their distribution in the DG, CA1, and CA3 of the hippocampus. (A1–A3) Sections from mice in the control group showed neither activated MG/MΦ nor MyD88-positive cells in these regions. Sections from mice at 1 day (B1–B3) and 3 days (C1–C3) after SE showed increased expression of MyD88 specifically in MG/MΦ (identified by iba-1 immunoreactivity). (D1–D3) Higher magnification of the boxes in (C1–C3). Arrows show cells with strong MyD88 and iba-1 immunoreactivity. The insets of (D1, D2, and D3) show additional high-magnification images of MyD88-positive MG/MΦ. (E) Quantitative analysis of iba-1/MyD88 double-labeled cells in hippocampi of control group mice 1 or 3 days after SE (means ± SEM, n = 3). *p < 0.05, **p < 0.01, ***p < 0.001 between groups. One-way ANOVA followed by Tukey’s test. ND = not detectable. Scale bars: (A1–C3) 100 μm; (D1–D3) 50 μm; (D3) (inset) 12.5 μm

