

Abstract
Noise is definitely a nuisance to the quality of people’s lives and health. In recent decades the public has suffered from industrial and environmental noise and its control has had a desirable impact on people’s lives. Though noise cannot be completely eliminated, it can be mitigated to a level that it is less harmful to people’s health. One of the ways for obtaining these pleasing environment is to design and use the absorbing sound materials. Fibrous and porous materials are the ordinary absorptive materials that are not good absorbers for low and mid frequency sounds. In this study, we examined the different parameters that affect the quality of absorbers, which could provide the best pattern for mid to low frequencies with the numerical and analytical models. For this purpose, three methods including measurement of absorption coefficient by impedance tube, analytical and numerical methods were used. Accuracy was determined by comparing measurement and two prediction methods. The results showed that the experimental and analytical methods provided by the Delany and Bazely and finite element (COMSOL) modeling have good adaptation. The best thickness of porous sound absorbers for low to mid frequencies f:[80–5000]Hz is about 10 cm with the air flow resistivity of 10,000–30,000 Ns/ m4.
Keywords: Optimization, Absorbers, Frequency, Noise, Modeling, Analytical
Introduction
Noise as an undesired sound is considered a nuisance in our working and social lives. Industrial and metropolitan noise propagation is recognized as an engineering problem and experts have attempted to mitigate it through sound absorbers [1–5]. Zent and John (2007) stated that there is no single material with the best performance for the sound absorption [6]. The porosity of the perforated panels and the density of the materials considerably could affect the acoustic impedance and the absorption coefficient [7]. Some authors advised improving the acoustical properties of the absorbers, by using newer multi-layered absorbents constructed from porous mineral fibers as the more efficient sound absorbers [8]. These materials are reported to have a higher efficiency of sound absorption in the mid and high frequencies because of their structures, but for low frequencies, their acoustical properties required to be optimized by the multi-layered absorbers [9].
Wang and Torng (2001) have conducted a research on the porous fiber materials, rock wool, and glass manufactured fibers in Taiwan and reported similar to sound absorptivity as the fiberglass. However, the increased thickness of these panels could improve the ability of the sound absorption, especially in the low to mid frequency range [10, 11]. Hong et al. (2007) found that a composite panel the consisting of a perforated panel, rubber particles, porous material, Polyurethane (PU) foam and glass wool can attenuate the sound considerably [11].
The attenuation of low to mid frequency sounds by absorbents is reported to be controversial according to some investigators [2, 12]. It was stated that the dynamics of dissipative force has the quadratic proportional rate to the frictional forces and fluxes, and the higher density of these materials enhanced the dissipation and absorption. Generally, there is a low absorptivity at the low to mid frequency regions with the homogenous materials [13]. The absorption of mid to low frequency sounds which is more prevalent in the industrial settings is more difficult than the higher frequencies ones. In the most of industrial and environmental settings, the absorption at lower frequencies noises are desired. So the influence factors such as thickness and weight are limited and sound absorbers with different flow resistivity can be used to achieve the expected results [14]. Zulkifli et al. (2008) have conducted a study on the acoustic properties of multi-layered coir fibers. They have indicated that the porosity and the density of the perforated panel may really influence acoustic impedance and absorbent coefficient of the panel [15]. It is also reported that different factors could influence the performance of the sound absorbers such as fiber diameter (in the fiber absorbers) porosity, thickness, resistance to flow, and density. For example, the finer fiber diameter and the resistance to air flow, density and thickness are higher could increase absorption. It should be noted that there are some limitations for these parameters, i.e. if the flow resistance is 1000 to 2000 MKS, absorbent can improve and in more or fewer amounts it could have no effect or attenuate absorption [16]. Lee and Chen (2001) reported that acoustic absorption of multi-layered materials are better than the perforated panel which has airspace that is located behind the holes [17].
The technical problem associated with the mid to low-frequency sound absorption in porous materials was a large amplitude of impedance characteristics in these frequencies. With the acoustic wave propagation through porous materials, porous fibers exert a drag force on the oscillated air particles, and irregular change of air flow will generate a virtual mass. The aggregation of drag force and virtual mass could form the complex density of porous materials [18]. The imaginary part of the complex density was reported to be inversely proportional to the frequency and is very high in low frequencies. Thus, the impedance characteristic is very large in mid to low-frequencies. Because of the high impedance between porous materials and air, the entrance of acoustic wave to the porous material was reported to be more difficult for the most of the acoustic wave. As a result, the performance of the absorption at low-frequencies was insufficient. However the thicker layer with more porosity reported to have smaller impedance characteristics, and, a quarter wavelength thickness was claimed to suitable for such absorbent. For example, for the frequency of 100 Hz, an absorber with a thickness of almost 0.85 cm was advised [19].
In order to optimize sound absorption, it was generally advised to predict and calculate the absorption based on the dependent parameters and optimize the parameters to obtain the desired absorption. Mechel et al. proposed diagrams for both monolayer and multi-layered absorbers with consideration of two parameters of thickness and air flow resistance, to combine the influence of the frequency [20]. Liu and Chen et al. applied the Johnson-Allard model for calculation of parameters and optimization of the absorption coefficient in multi-layered materials [4, 5]. Meng et al. examined gradient dispensation of the fiber diameters and porosity of the materials in order to for optimize the multi-layered sound absorption [21]. Zhang et al. applied a simulated generic arithmetic program to obtain the optimal combination of several parameters [8].
Due to the large inherent acoustic impedance, low and mid-frequency sound is difficult to absorb with former porous absorbers. Compared to the previous absorbers, which the empty pores were filled with air, in a study, the researchers used helium to fill the pores, which have lower acoustic impedance. The results showed that these absorbers had higher absorption at low-frequency sound with the same thickness [19].
Generally, development of more efficient sound absorbers for the nuisance mid to low frequency noise were requested by the acoustic experts as an urgent control priority [12].
Due to the limitations of studies regarding the noise absorption having mid to low-frequency sounds, the aim of this study was to define a model for optimal absorption of porous absorbers at mid and low frequencies. Thus, the measurements were initially carried out with a porous absorber and then several factors were examined. Then by analytical modeling through Delany and Bazley’s method and finite element (COMSOL) modeling, a real-time synchronization operation was performed, and finally, the prediction model was presented.
Material and methods
Sound absorbing experimental configurations
The sound absorption coefficient of the materials was measured by Type SW477 and SW422 Impedance Tubes (BSWA Technology Co.,Ltd.,China).The data obtained was used based on the transfer function method, which it has been adopted as an ISO 10534-2 standard [22]. The method has two microphones locations for sound absorption and a digital analysis system for specification of sound absorption (Fig. 1). In this device, there is a white noise source which generates the plane wave in the tube. There are also two locations inside the sample that measure sound pressure level. Two sets of cylindrical metal tubes in different diameters are available to measure sound properties in two range of frequencies. The inner diameter of a large tube is 100 mm and the measured frequency range is 63 to 1600 Hz. The inner diameter of the small tube is 30 mm and the measured frequency range is from 1000 to 6300 Hz. In fact, the range of the range of the measured frequencies is the difference in the action between the small and large tube. A pair of microphones located beside the sample is mounted in the inner wall of the tube. Each experiment was repeated twice. The microphones need to be calibrated with its’ calibrator at 1000 Hz and 114 dB sound pressure level. The laboratory conditions were as follows: Dry temperature: 25°c, Atmospheric pressure: 83326.5 Pa.
Fig. 1.

System set up for experimental absorption coefficient measurements by impedance tube
In this study, the necessary calculations for the absorption coefficient and solving of transfer functions were carried out using a MATLAB computer program.
The study was conducted at the Acoustic Laboratory and the background noise was measured and reported as 35 dB (A). Figure 2 shows the experimental set up of the study.
Fig. 2.

Experimental set up of the study
If the sample does not fit properly in its’ location, then the measured absorption coefficient will not be accurate mainly due to air leakage around the sample edges into the impedance tube. Thus, Specimens cutting is a critical task. Two sample cutters are shown in Fig. 3 were ordered for precise cutting of the samples in 10 and 30 cm diameters. The edges of the specimens were also coated with petroleum jelly to prevent side leakages and to improve the fitness of the sample with the tube.
Fig. 3.

The sample cutters
The properties of the used samples in this experiments are presented in Table 1. There are 9 porous samples which are commonly used in noise control. In our experimental measurements at the intended frequency range, all of the sound absorption curves were free from the resonance effects.
Table 1.
Material properties of the tested specimens
| Sample | Resistance to air flow (Ns/m4) | Thickness (cm) | Density (kg/m3) |
|---|---|---|---|
| 1–3 | 35,000,29,000,25,500 | 3,5,10 | 80 |
| 4–6 | 40,000,33,500,29,000 | 3,5,10 | 100 |
| 7–9 | 88,000,70,000,78,000 | 3,5,10 | 150 |
Prediction of the absorption coefficient
The transfer matrix method
According to the transfer matrix method, the input impedance of a multi-layered composition of the porous material was calculated using the input impedance equation of the single-layer structure according to the following equation [23]:
| 1 |
Where Zfront is the input impedance of the porous material, L is the thickness of the ith layer, Zback is the input impedance of the back layer, Zc is the characteristic impedance of the porous material and γ is the constant propagation of the porous material. Assuming that the wall is rigid, Zback would be unlimited and the relation is simplified as Eq. 2:
| 2 |
One-layer configuration is illustrated in Fig. 4.
Fig. 4.
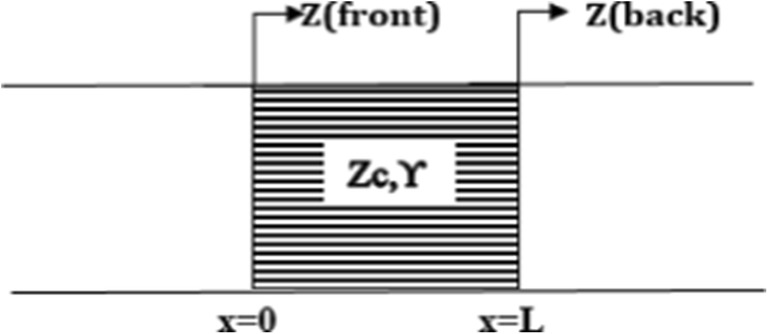
Schematic of one-layer configuration
The sound absorption coefficient was calculated using the following equations [24, 25]:
| 3 |
| 4 |
where R is the complex reflection factor [dimensionless], Zi is the input impedance of the porous material (Zfront) [Pa.s.m−1], and ρc is the air impedance of the configuration [Pa.s.m−1], c = 344 m/s is the speed of sound in air at room temperature, and ρ = 1.204 kg /m3 is the density of the air at room temperature. The calculation of surface impedance was carried out using transfer matrix method and applying the individual characteristic impedances Zi[Pa.s.m−1] and propagation constants of each layer (i) in the samples.
Impedance prediction methods
Analytical modeling
The analytical Impedance prediction methods have been investigated and developed by Delany and Bazley, Mechel and Vér, Komatsu, Mechel, Miki, Qunli, as well as Allard and Champoux [20, 24–28] .In all of these methods, material thickness and specific flow resistivity are independent variables. David Oliva et al. defined the prediction error in order to assess the accuracy of each method. The prediction error is the difference between measured and predicted absorption coefficients. This value was less than 0.01 for Delany and Bazley and less than 0.02 for Allard and Champoux methods [3]. Hence, Delany and Bazley’s method was used in this study to predict characteristic impedance. Delany and Bazley developed their method based on impedance tube testing results on various fibrous porous materials [24]. According to the experimental results, they defined the following empirical formulae for the characteristic impedance (Zc) and the propagation constant (γ) of the porous materials in terms of flow resistivity:
| 5 |
| 6 |
| 7 |
Where Zc is the characteristic impedance, ρ0 is the air density, f is frequency, and σ is the flow resistivity of the porous material and γ is the propagation constant of the porous materials.
Finite element modeling (COMSOL modeling)
The finite element analysis method is a robust and modern computational tool for solving engineering problems. COMSOL software is a tool for finite element analysis specifically designed to analyze metaphysics problems. It is a complete set of multifunctional simulations that can solve partial differential equations for analyzing the behavior of linear and nonlinear systems applying the finite element method in one, two, and three-dimensional spaces. It can be simulated in a single physical or multi-physical manner (with the coupling of two or more physics) to simulate different processes and to examine their simultaneous effects [29]. In this study, for numerical simulation, the COMSOL software was used.
Validation of the analytical, numerical and experimental methods
Validation of the experimental method
In order to validate the experimental method, the impedance tube was calibrated at first according to the manual published by the manufacturer of impedance tube. Subsequently, the results of the samples measured by Impedance tube were compared with the standard results given by the respective manufacturer.
Validation of the analytical and numerical methods
The analytical (Delaney and Bazely) and the numerical methods were validated by comparing their results with validated benchmark data [30].
Results and discussions
The comparison of the three methods
Eventually, the results of a specific porous sample tested with the three aforementioned methods were compared together to check the three applied methods. The results are shown in Fig. 5. The results obtained from the analytical and numerical methods well agree with the experimental results, representing the accuracy of the analytic method and numerical modeling. The parameters of air and porous material are listed in Table 2.
Fig. 5.

Comparison of analytical, numerical and experimental diagrams
Table 2.
Input constant parameters of air (25 °C) and porous material
| Parameter | Value | Units |
|---|---|---|
| C0 | 340 | m/s |
| ρ0 | 1.21 | kg/m3 |
| ρ | 150 | kg/m3 |
| Zc | 411.4 | kg/m2.s |
| σs | 80,000 | N.s/m4 |
| L | 5 | cm |
| f | [80–5000] | Hz |
Optimization
Effects of the sample thickness
The effect of increasing the sample thickness on the sound absorption coefficient was investigated in this study. The laboratory conditions such as room temperature, humidity, and barometric pressure and the density of the rock wool (80 kg/m3) were kept constant. The analytical diagrams computed using the theoretical method and MATLAB software are shown in Fig. 6a. The numerical diagrams calculated by the finite element method and the COMSOL software are illustrated in Fig. 6b and the experimental diagrams that were measured by the impedance tube are shown in Fig. 6c. The compatibility of the results obtained from analytical, numerical and experimental diagrams, according to statistical test was demonstrated.
Fig. 6.

Absorption coefficient of the porous absorber at different thicknesses determined through analytical (a), numerical (b) and experimental (c) methods
In order to maximize adhesion and heat loss in porous materials, it is necessary to maximize the wave-induced particle velocity. The most suitable place for the using the porous absorbers is in case of condition when particle velocity of the sound wave is maximal [13]. Hence for obtaining the maximum absorption coefficient, it is necessary to use the porous material with a thickness equal to one-fourth of the wavelength of the incoming sound. In the low frequencies, sound waves with a higher wavelength, which means that thicker materials contributed in better absorption coefficient [2]. In the other studies, they stated that at the lower frequencies due to higher wavelengths, required thicker absorbers [15, 16]. A study by Azkorra et al. also showed that an increase in the thickness of the samples, the performance of the absorber could increase as demonstrated in Fig. 6 [31]. It is obvious that the lower the frequency of the input sound (higher wavelength (λ = C/F), required a thicker absorber. So, if there is a limitation in applying the essential thickness, the porous material alone is not suitable for low-frequency absorption [14].
The effect of airflow resistivity distribution
In this section, the results of the increasing the air flow resistivity on the sound absorption coefficient was investigated. The laboratory conditions such as room temperature, humidity, and barometric pressure were kept constant and the thickness of the rock wool was 5 cm. In Fig. 7, the three categories of figures having analytical (a), numerical (b) and experimental (c) methods are illustrated.
Fig. 7.

The absorption coefficient of porous absorber at different flow resistivity determined by analytical (a), numerical (b) and experimental (c) methods
As shown in Fig. 7 with increasing the flow resistivity of the porous material, the performance of the absorber was decreased. In fact, with increasing the air flow resistivity, the sound hardly can penetration into the pores of the material and the sound reflection increases. As a result, the sound absorption coefficient would be decreased. By decreasing the air flow resistivity to a certain extent, the sound absorption coefficients were reduced. The airflow resistivity is one of the most important parameters that affect the sound absorbing characteristics of the porous materials. Two acoustical properties of porous materials i.e. propagation constant and characteristic impedance could describe the quality of the material. These important acoustical variables were governed according to the air flow resistance of the porous material. In general, when the sound enters the porous absorber, the friction between pores and air will decrease the sound’s amplitude. The waves try to move through the pores of the absorbers leading to the conversion of the acoustic energy into heat loss. The resultant friction and heat release are similar to an acoustic resistance that it depends on the material’s resistance to the flow, and its dependence to the frequency is small. As a result, to have a good porous sound absorber, the flow resistivity must be in a specified range. Because if its value is too high, the sound wave cannot easily enter into the material, and if its value is very low, there is not enough friction to reduce the energy of the sound wave [32].
Sensitivity analysis of thickness parameter
In this analysis, porous absorbers with 20,000 Ns/m4 flow resistivity was used. The thickness of the sound absorber was changed from d: [1–10] cm at the frequencies, f:[80–5000]Hz.
According to Fig. 8, with increasing porous absorber thickness, generally, a higher absorption coefficient is observed at lower frequencies. As shown in the above figure, for the frequency of 700 Hz, which shows t the best absorption coefficient, the results are shown in Table 3.
Fig. 8.

Sensitivity of the porous absorber behavior to the thickness parameter
Table 3.
Absorption coefficient regard to thickness for frequency of 700 Hz
| Thickness (cm) | 1 | 2 | 3 | 4 | 5 | 6 | 7 | 8 | 9 | 10 |
|---|---|---|---|---|---|---|---|---|---|---|
| Absorption coefficient | 0.06 | 0.2 | 0.43 | 0.66 | 0.82 | 0.89 | 0.91 | 0.9 | 0.88 | 0.86 |
As it was demonstrated in Table 3, by increasing the thickness of the absorber up to 5 cm, the absorption coefficient for the frequency of 700 Hz was strongly increased. At higher thickness, the absorption curve is almost flat. In the above diagram (Fig. 8), the initial range defined as the pink bar is the absorption of 90% and higher. The changing color of contours demonstrating the decrease in absorption from the top to the bottom of the chart illustrated the change from 80 to 10%, respectively. With increasing the thickness, the wave is absorbed more efficiently and the reflection of energy decreased.
Sensitivity analysis of the flow resistivity parameter
In the sensitivity analysis of this study, the thickness of 10 cm was applied. The effect of flow resistivity from σ:[103–105] Ns/m4 in the frequencies f:[80–5000]Hz on the absorption coefficient curve was investigated.
According to the Fig. 9, the best flow resistivity is in the range of σ:[10000–30,000] Ns/m4. As it is expected, the value of extreme high and low flow resistivity (Table 4) did not produce the desired absorption coefficients. As shown in the figure, the higher range of the pink bar had the perfect absorbing performance (90% and higher).
Fig. 9.

Sensitivity of porous absorber relative to the flow resistivity parameter
Table 4.
Absorption coefficient regard to flow resistivity for frequency of 700 Hz
| Flow resistivity (Ns/m4) × 104 | 1 | 2 | 3 | 4 | 5 | 6 | 7 | 8 | 9 | 10 |
|---|---|---|---|---|---|---|---|---|---|---|
| Absorption coefficient | 0.7 | 0.82 | 0.81 | 0.77 | 0.72 | 0.72 | 0.67 | 0.62 | 0.54 | 0.50 |
Airflow resistivity influenced the acoustic impedance and as a result the sound reflection. As it was stated in the literature a higher density and flow resistivity materials due to the mass increase, could increase the sound absorption [33]. However, as discussed earlier, this effect is limited to a narrow range. The performance of the absorber could decrease by a high flow resistivity since sound cannot penetrate in the absorbing material.
Conclusion
This study focused on providing information an optimal porous absorbent for reducing the mid to low frequency sounds. To assess the performance of the porous sound absorbers, two models (analytical and numerical) of prediction and the experimental measurement were considered. According to the results, the accuracy of the analytic method and numerical modeling were in agreement. The two important factors that influenced the porous material’s sound absorbing capability, were the flow resistivity and thickness. Though the thickness of the materials had a direct relationship with sound absorbing property at low-frequency range (80-1600 Hz), it is insignificant in the medium range sound frequency (>1600 Hz). In this study, the porous materials absorbed sounds with frequencies lower than 300 Hz at the maximum thickness and the best absorption coefficient of the material is less than 60%, which indicated the limitation of porous absorbers at low frequencies. At mid frequencies with increasing the thickness of the porous material, the performance increased up to 90%. But after a certain thickness, the absorbing performance was saturated. The maximum flow resistivity in the frequencies lower than 300 Hz, had an absorption coefficient of less than 50%. But at higher frequencies up to 1600 Hz, an increase in the flow resistivity could elevate the sound absorption by up to 90%. Generally, too large and too small flow resistivity did not produce optimal absorption coefficients and at low to mid-frequencies sounds, the best flow resistivity was in the range of σ:[10,000–30,000] Ns/m4.
Acknowledgments
This article is extracted from a Ph.D. thesis in the field of occupational health engineering. The authors would like to appreciate the Shahid Beheshti University of Medical Sciences for their technical and financial support with the grant number of 7752. The study was approved by their respective university ethics’ committee.
Compliance with ethical standards
Conflict of interest
The authors confirm no conflicts of interest associated with this publication.
References
- 1.Lee J-K, Kim J, Rhee C-J, Jo C-H, Choi S-B. Noise reduction of passive and active hybrid panels. Smart Mater Struct. 2002;11(6):940–946. doi: 10.1088/0964-1726/11/6/315. [DOI] [Google Scholar]
- 2.Amares S, Sujatmika E, Hong T, Durairaj R, Hamid H. A review: characteristics of noise absorption material. J Phys Conf Ser. 2017;908(1):012005. doi: 10.1088/1742-6596/908/1/012005. [DOI] [Google Scholar]
- 3.Oliva D, Hongisto V. Sound absorption of porous materials–accuracy of prediction methods. Appl Acoust. 2013;74(12):1473–1479. doi: 10.1016/j.apacoust.2013.06.004. [DOI] [Google Scholar]
- 4.Liu S, Chen W, Zhang Y. Design optimization of porous fibrous material for maximizing absorption of sounds under set frequency bands. Appl Acoust. 2014;76:319–328. doi: 10.1016/j.apacoust.2013.08.014. [DOI] [Google Scholar]
- 5.Chen W, Liu S, Tong L, Li S. Design of multi-layered porous fibrous metals for optimal sound absorption in the low frequency range. Theor Appl Mech Lett. 2016;6(1):42–48. doi: 10.1016/j.taml.2015.12.002. [DOI] [Google Scholar]
- 6.Zent A, Long JT. Automotive sound absorbing material survey results. SAE Technical Paper0148–7191. 2007.
- 7.Davern WA. Perforated facings backed with porous materials as sound absorbers—An experimental study. Appl Acoust. 1977;10(2):85–112. doi: 10.1016/0003-682X(77)90019-6. [DOI] [Google Scholar]
- 8.Zhang B, Zhang W, Zhu J. Third International Conference on Smart Materials and Nanotechnology in Engineering. 2012. Optimization of sound absorbing performance for gradient multi-layer-assembled sintered fibrous absorbers; p. 84090C. [Google Scholar]
- 9.Rozli Z, Zulkarnain Z. Noise control using coconut coir fiber sound absorber with porous layer backing and perforated panel. Am J Appl Sci. 2010;7(2):260–264. doi: 10.3844/ajassp.2010.260.264. [DOI] [Google Scholar]
- 10.Wang C-N, Torng J-H. Experimental study of the absorption characteristics of some porous fibrous materials. Appl Acoust. 2001;62(4):447–459. doi: 10.1016/S0003-682X(00)00043-8. [DOI] [Google Scholar]
- 11.Hong Z, Bo L, Guangsu H, Jia H. A novel composite sound absorber with recycled rubber particles. J Sound Vib. 2007;304(1–2):400–406. doi: 10.1016/j.jsv.2007.02.024. [DOI] [Google Scholar]
- 12.Puranik RRPPR, Rana PP. Nonwoven acoustic textiles – a review. International Journal of Advanced Research in Engineering and Technology (IJARET) 2014;5(3):8. [Google Scholar]
- 13.Mei J, Ma G, Yang M, Yang Z, Wen W, Sheng P. Dark acoustic metamaterials as super absorbers for low-frequency sound. Nat Commun. 2012;3:756. doi: 10.1038/ncomms1758. [DOI] [PubMed] [Google Scholar]
- 14.Fuliang GL. Development and Applications of Sound-absorbing Materials [J]. 2007;2:021.
- 15.Zulkifh R, Nor M, Tahir M, Ismail A, Nuawi M. Acoustic properties of multi-layer coir fibres sound absorption panel. J Appl Sci. 2008;8(20):3709–3714. doi: 10.3923/jas.2008.3709.3714. [DOI] [Google Scholar]
- 16.Chen W-H, Lee F-C, Chiang D-M. On the acoustic absorption of porous materials with different surface shapes and perforated plates. J Sound Vib. 2000;237(2):337–355. doi: 10.1006/jsvi.2000.3029. [DOI] [Google Scholar]
- 17.Lee F-C, Chen W-H. Acoustic transmission analysis of multi-layer absorbers. J Sound Vib. 2001;248(4):621–634. doi: 10.1006/jsvi.2001.3825. [DOI] [Google Scholar]
- 18.Zwikker C, Kosten CW. Sound absorbing materials. New York City: Elsevier; 1949. [Google Scholar]
- 19.Choy Y, Huang L, Wang C. Sound propagation in and low frequency noise absorption by helium-filled porous material. JASA. 2009;126(6):3008–3019. doi: 10.1121/1.3257182. [DOI] [PubMed] [Google Scholar]
- 20.Mechel F. Design charts for sound absorber layers. JASA. 1988;83(3):1002–1013. doi: 10.1121/1.396045. [DOI] [Google Scholar]
- 21.Meng H, Ao Q, Tang H, Xin F, Lu T. Dynamic flow resistivity based model for sound absorption of multi-layer sintered fibrous metals. SCIENCE CHINA Technol Sci. 2014;57(11):2096–2105. doi: 10.1007/s11431-014-5652-8. [DOI] [Google Scholar]
- 22.Din E.10534-2: acoustics-determination of sound absorption coefficient and impedance in impedance tubes-part 2: transfer-function method.
- 23.Dunn I, Davern W. Calculation of acoustic impedance of multi-layer absorbers. Appl Acoust. 1986;19(5):321–334. doi: 10.1016/0003-682X(86)90044-7. [DOI] [Google Scholar]
- 24.Delany M, Bazley E. Acoustical properties of fibrous absorbent materials. Appl Acoust. 1970;3(2):105–116. doi: 10.1016/0003-682X(70)90031-9. [DOI] [Google Scholar]
- 25.Allard JF, Champoux Y. New empirical equations for sound propagation in rigid frame fibrous materials. JASA. 1992;91(6):3346–3353. doi: 10.1121/1.402824. [DOI] [Google Scholar]
- 26.Mechel FP, Ver IL. Sound absorbing materials and sound absorbers. New York: Noise and Vibration Control Engineering, John Wiley & Sons; 1992.
- 27.Miki Y. Acoustical properties of porous materials-modifications of Delany-Bazley models. J Acoust Soc Jpn(E) 1990;11(1):19–24. doi: 10.1250/ast.11.19. [DOI] [Google Scholar]
- 28.Qunli W. Empirical relations between acoustical properties and flow resistivity of porous plastic open-cell foam. Appl Acoust. 1988;25(3):141–148. doi: 10.1016/0003-682X(88)90090-4. [DOI] [Google Scholar]
- 29.Wang C, Huang L. On the acoustic properties of parallel arrangement of multiple micro-perforated panel absorbers with different cavity depths. J Acoust Soc Am. 2011;130(1):208–218. doi: 10.1121/1.3596459. [DOI] [PubMed] [Google Scholar]
- 30.Cox T, d’Antonio P. Acoustic absorbers and diffusers: theory, design and application. United States: CRC Press, Taylor and Francis; 2016. [Google Scholar]
- 31.Azkorra Z, Pérez G, Coma J, Cabeza LF, Bures S, Álvaro JE, Erkoreka A, Urrestarazu M. Evaluation of green walls as a passive acoustic insulation system for buildings. Appl Acoust. 2015;89:46–56. doi: 10.1016/j.apacoust.2014.09.010. [DOI] [Google Scholar]
- 32.Seddeq HS. Factors influencing acoustic performance of sound absorptive materials. Aust J Basic Appl Sci. 2009;3(4):4610–4617. [Google Scholar]
- 33.Huang Z, Wang X. Sound absorbing performance optimization based on characteristic impedance. 24th International Congress On Sound and Vibration, 23-27 July 2017, London.