

Abstract
Speech understanding abilities are highly variable among cochlear implant (CI) listeners. Poor electrode–neuron interfaces (ENIs) caused by sparse neural survival or distant electrode placement may lead to increased channel interaction and reduced speech perception. Currently, it is not possible to directly measure neural survival in CI listeners; therefore, obtaining information about electrode position is an alternative approach to assessing ENIs. This information can be estimated with computerized tomography (CT) imaging; however, postoperative CT imaging is not often available. A reliable method to assess channel interaction, such as the psychophysical tuning curve (PTC), offers an alternative way to identify poor ENIs. This study aimed to determine (a) the within-subject relationship between CT-estimated electrode distance and PTC bandwidths, and (b) whether using focused stimulation on channels with suspected poor ENI improves vowel identification and sentence recognition. In 13 CI listeners, CT estimates of electrode-to-modiolus distance and PTCs bandwidths were measured for all available electrodes. Two test programs were created, wherein a subset of electrodes used focused stimulation based on (a) broad PTC bandwidth (Tuning) and (b) far electrode-to-modiolus distance (Distance). Two control programs were also created: (a) Those channels not focused in the Distance program (Inverse-Control), and (b) an all-channel monopolar program (Monopolar-Control). Across subjects, scores on the Distance and Tuning programs were significantly higher than the Inverse-Control program, and similar to the Monopolar-Control program. Subjective ratings were similar for all programs. These findings suggest that focusing channels suspected to have a high degree of channel interaction result in quite different outcomes, acutely.
Keywords: speech perception, imaging, psychophysics, channel selection
Introduction
Outcomes are highly variable among cochlear implant (CI) listeners, potentially because of variations in perceptual acuity across stimulation sites (e.g., Holden et al., 2013; Won, Drennan, & Rubenstein, 2007). Studies in CI listeners have demonstrated across-site variation in spatial spread of excitation (Abbas, Hughes, Brown, Miller, & South, 2004; J. A. Bierer and Faulkner, 2010; DeVries, Scheperle, & Bierer, 2016; Jones, Ho Won, Drennan, & Rubenstein, 2013; Nelson, Donaldson, & Kreft, 2008; Zhou et al., 2017), electrode discrimination (Throckmorton & Collins, 1999; Zwolan, Collins, & Wakefield, 1997), and behavioral thresholds (J. A. Bierer, 2007; DeVries, Scheperle, & Bierer, 2016; Long et al., 2014; Pfingst, Xu, &Thompson, 2004). This variation may be partially attributable to the electrode–neuron interface (ENI), which refers to peripheral factors such as spiral ganglion neuron density, electrode position, bone growth, and other factors (e.g., J. Bierer, 2010). Channels with suspected poor ENIs may cause a high degree of channel interaction, which occurs when the neural excitation patterns of adjacent channels overlap. Increased channel interaction can distort spectral information and lead to decreased pitch and speech perception (e.g., Jones et al., 2013), emphasizing the importance of identifying aspects of the ENI that contribute to increased channel interaction.
Human temporal bone studies have shown nonuniform distributions of spiral ganglion neural density in CI listeners and individuals with hearing loss (Khan, Handzel, Damian, Eddington, & Nadol, 2005; Linthicum, Fayad, Otto, Galey, & House, 1991; Nadol, 1997). Animal studies have also demonstrated that long-term deafness results in smaller evoked potential responses and fewer surviving spiral ganglion neurons (Hall, 1990; Shepherd & Javel, 1997; Smith & Simmons, 1983). However, histological studies have not shown a correlation between neural survival and speech perception in CI listeners (e.g., Khan et al., 2005). While it is not yet possible to directly measure neural survival in vivo in humans, several investigators are studying indirect measures of neural health (DeVries et al., 2016; Long et al., 2014; Zhou & Pfingst, 2016).
Another major component of the ENI, electrode position, can be directly assessed using computerized tomography (CT) imaging techniques. CT imaging can provide estimates of electrode-to-modiolus distance, scalar location, insertion angle, and wrapping factor (Holden et al. 2013; Skinner et al., 2007; Teymouri, Hullar, Holden, & Chole, 2011; Verbist, Frijns, Geleijns, & Van Buchem, 2005). Suboptimal electrode positions lead to increased channel interaction and higher focused thresholds in humans (Cohen, Saunders, & Clark, 2001; DeVries et al., 2016; Kawano, Seldon, Clark, Ramsden, & Raine, 1998; Long et al., 2014), in animals using electrophysiological measures (Jolly, Spelman, & Clopton, 1996; Shepherd, Hatsushika, & Clark, 1993), and in computational modeling studies (Briaire & Frijns, 2006; Cohen, 2009; Frijns, De Snoo, & Schoonhoven, 1995; Goldwyn, Bierer, & Bierer, 2010; Kalkman, Briaire, Dekker, & Frijns, 2014). Electrode arrays with poor placement often result in poorer performance on speech perception tasks, though results are mixed (DeVries et al., 2016; Finley et al., 2008; Skinner et al., 2002). While useful, this technique is limited in terms of clinical application. Postoperative CT scans are not often available to clinicians, incur high costs, and expose patients to radiation. Therefore, assessing alternative methods to measure electrode position is warranted.
A recent study evaluated the electrically evoked compound action potential (ECAP) as a possible objective measure of CT-estimated electrode-to-modiolus distance in CI listeners (DeVries et al., 2016). ECAP spread of excitation was moderately correlated of electrode-to-modiolus distance in most subjects, similar to a study by Cohen Richardson, Saunders, and Cowan (2003) using radiographs. However, the ECAP can be unreliable as some subjects do not have measurable responses, and responses can be small and contain large stimulus artifact.
In this study, a potentially more reliable measure of channel interaction was used: the psychophysical tuning curve (PTC). Broad PTCs have been correlated with higher behavioral thresholds using focused stimulation, identifying suspected areas of excessive channel interaction (J. A. Bierer and Faulkner, 2010; Nelson et al. 2008). Recently, we measured PTCs using focused stimulation for all electrodes in 13 subjects, using a Bekesy-like, sweep procedure used for measuring thresholds in CI listeners (J. A. Bierer, Bierer, Kreft, & Oxenham, 2015; DeVries & Arenberg, 2018); most of the same subjects participated in this study. In that study, PTC bandwidths were correlated of CT-estimated electrode-to-modiolus distance, but not focused behavioral thresholds, across subjects.
Hypothetically, the correlation between PTC bandwidths and CT-estimated electrode-to-modiolus distance may be exploited to create new listener programs to reduce channel interaction. As PTCs likely capture aspects of the ENI other than electrode position, it is useful to compare performance with CT-based and PTC-based programs. For instance, broad PTCs not correlated with electrode-to-modiolus distance may indicate areas of poor neural health, providing useful information beyond what CT estimates can offer.
One approach to improve speech perception has been to deactivate electrodes to reduce channel interaction (J. A. Bierer & Litvak, 2016; Noble, Labadie, Gifford, & Dawant, 2013; Noble, Gifford, Hedley-Williams, Dawant, & Labadie, 2014; Noble et al., 2016) or improve a psychophysical percept (Garadat, Zwolan, & Pfingst, 2013; Henshall & McKay, 2001; Saleh, Saeed, Meerton, Moore, & Vickers, 2013; Vickers, Degun, Canas, Stainsby, & Vanpoucke, 2016; Zhou & Pfingst, 2012) with mixed results. In Noble’s studies, computational modeling and CT estimates were used to deactivate electrodes modeled to have excessive channel interaction. After 1-month experience with the experimental program, there were significant improvements on sentence recognition and increased subjective quality of communication. However, deactivating electrodes with poor electrode position may sacrifice the opportunity to improve spectral resolution by limiting the stimulation of viable neurons in that region. Using focused stimulation for these channels may serve to compensate for increased distance from the target neurons while minimizing channel interaction caused by the narrower current spread.
Several studies have used focused stimulation across the electrode array to reduce channel interaction and improve speech perception (Berenstein, Mens, Mulder, & Vanpoucke, 2008; J. A. Bierer & Litvak, 2016; Srinivasan, Padilla, Shannon, & Landsberger, 2013). Across studies, results are mixed, but with notable improvements in speech perception in noise. While encouraging, focused stimulatiion has some practical limitations for clinical use. This stimulation may have higher current level requirements, which could lead to greater power consumption and issues with voltage compliance limits (J. A. Bierer & Litvak, 2016). Side-lobe activation can also occur when using a high degree of focusing, which can increase channel interaction in unpredictable ways (Litvak, Spahr, Saoji, & Fridman, 2007). However, if only a subset of channels estimated to have poor electrode position uses focused stimulation, some of these limitations may be ameliorated. To date, channel selection strategies using behavioral data and focused stimulation are limited and have not incorporated electrode position.
The aim of this study is to (a) assess the within-subject relationship between CT-estimated electrode-to-modiolus distance and PTC bandwidths, and (b) determine whether using this information to create individualized programs improves speech perception in an acute setting. Two test programs were created that use focused stimulation on a subset of channels, selected based on (a) far electrode-to-modiolus distance from CT estimates (Distance),and (b) broad tuning from PTC bandwidths (Tuning). Two control programs were also created (a) Channels not focused in the Distance program were focused (Inverse-Control) and (b) broad stimulation for all channels (Monopolar-Control). The Inverse-Control program evaluates how focusing electrodes close to the modiolus affects speech perception; focusing all electrodes would not allow us to evaluate perceptual detriments when focusing only ostensibly “good” channels. The Monopolar-Control program evaluates how the test programs compare stimulation similar to what CI listeners hear every day. We expect that the Inverse-Control program will be detrimental to speech perception, as areas with excessive channel interaction may still be uncontrolled, or there may not be sufficient spiral ganglion neurons activated because of current focusing and neural sparsity, as suggested by J. A. Bierer and Litvak (2016). We further hypothesize subjects will have higher scores with the Tuning and Distance programs, as compared with the controls. Subjects were tested on closed set medial vowel identification, a spectrally challenging task, and open-set sentence recognition, which may reflect more real-world conditions. Subjects also completed a sound quality questionnaire to assess subjective program preferences. The results of this study may provide an important link between site-specific peripheral measures of the ENI and the practical application of these measures to CI listener programs.
Methods
Subjects
A total of 13 adult subjects who were unilaterally implanted after 2001 with Advanced Bionics HiRes90k devices participated (Table 1); 12 of these subjects participated in the previously mentioned study by DeVries and Arenberg (2018). Subjects were at least 21 years of age (M = 66.2, standard deviation [SD] = 10.65) and there were eight men in the study. Two subjects were prelingually deafened (S49, S53), one was peri-lingually deafened (S40), and the remaining 10 were postlingually deafened. One of the postlingual subjects was deafened in childhood (S46, age 14), but is still considered with the postlingually deafened subjects as they learned language before they were diagnosed with a severe-to-profound hearing loss. All subjects were fluent English speakers. Each participant provided written consent and the experiments were conducted in accordance with guidelines set by the University of Washington Human Subjects Division.
Table 1.
Demographic Information.
| ID | Ear | Age | Age @ profound HL | Age implanted | Duration (years) | Etiology | Electrode array/ spacing (mm) | CNC word score (%) |
|---|---|---|---|---|---|---|---|---|
| S22 | R | 77 | 55 | 66 | 11 | Suspected genetic | 1 J Helix/0.85 | 50 |
| S29 | L | 86 | 47 | 77 | 30 | Noise | HiFocus 1 J/1.1 | 76 |
| S40 | L | 55 | 4 | 50 | 46 | EVA | HiFocus 1 J/1.1 | 20 |
| S42 | R | 67 | 50 | 50 | 0 | Idiopathic | HiFocus 1 J Positioner/0.9 | 93 |
| S43 | R | 71 | 50 | 67 | 17 | Noise | Mid-Scala/0.85 | 78 |
| S46 | R | 66 | 14 | 62 | 48 | Unknown | HiFocus 1 J/1.1 | 30 |
| S47 | R | 68 | 28 | 37 | 9 | Unknown | Mid-Scala/0.85 | 83 |
| S49 | R | 44 | 1.5 | 43 | 41.5 | Suspected genetic | Mid-Scala/0.85 | 30 |
| S53 | R | 54 | 1 | 44 | 43 | Meningitis | 1 J Helix/0.85 | 84 |
| S52 | R | 70 | 60 | 60 | 10 | Idiopathic | HiFocus 1 J/1.1 | 52 |
| S55 | R | 63 | 41 | 49 | 8 | Suspected genetic | HiFocus 1 J/1.1 | 92 |
| S56 | L | 72 | 30 | 58 | 28 | Idiopathic | HiFocus 1 J Pos./0.9 | 76 |
| S57 | R | 67 | 63 | 65 | 2 | Idiopathic | Mid-Scala/0.85 | 62 |
Note. Table 1 shows demographic information for all 13 subjects including ear implanted, chronological age, age diagnosed with a profound hearing loss, age at implantation, duration of deafness, etiology (if known), electrode array type and electrode spacing, and clinical CNC word score. CNC = consonant–nucleus vowel–consonant; HL = hearing loss; EVA = enlarged vestibular aqueduct.
CT Imaging
CT scans were performed at the University of Washington Medical Center within the last 3 years. Briefly, ANALYZE software was used to create three-dimensional image volumes by combining information from each subject’s postoperative scan and a single body donor cochlea (Figure 1; for details, see Skinner et al., 2007; for verification of the method, see Teymouri et al., 2011). Preoperative CT scans were not available for the subjects participating in this study; therefore, a scan of the nonimplanted ear was used to identify structural anatomy, and this image was coregistered with the image of the implanted ear. Micro CT and orthogonal-plane fluorescence optical sectioning images from a donor cochlea were used to locate and visualize the nonbony structures. The CT-estimated metric used in this study was electrode-to-modiolus distance, which refers to the lateral distance (in millimeters) of an electrode from the medial wall of the cochlea.
Figure 1.

CT view of cochlea and electrode array along the midmodiolar axis (red and yellow dashed line), for all subjects, organized by electrode array type. The evenly spaced red dots represent electrodes; the outermost dot represents the insertion depth marker. The white line represents the 0° reference point from which insertion depth is measured, extending from the midmodiolar axis. Row 1: 1 J; Row 2: 1 J Helix and 1 J with positioner; Row 3: MidScala electrode array. CT = computerized tomography; ERB = equivalent rectangular bandwidth.
Source: Reproduced with permission from DeVries and Arenberg (2018).
Electrode Configurations
All stimuli were presented using the Bionic Ear Data Collection System version 1.18.315 (Advanced Bionics, Valencia, CA). For psychophysical testing, a custom Matlab (Mathworks, Inc., Natick, MA) program controlled the BEDCS software. Three types of electrode configurations were used in this study: monopolar (MP), steered quadrupolar (sQP), and partial tripolar (pTP).
The MP configuration consists of an active intracochlear electrode and a return extracochlear electrode; the large distance between the source/sink yields a broad electrical field (e.g., Litvak et al., 2007). The sQP configuration consists of four intracochlear electrodes: The two middle electrodes serve as active electrodes, and the two outer electrodes serve as return electrodes for a fraction of the active current (an extracochlear electrode carries the remainder of the return current). Current is steered between the two middle electrodes according to the fraction, α: A value of 1 steers current to the basal electrode and 0 to the apical electrode. By convention, channel number is defined as the basal active electrode when α = 1. In this study, this convention was maintained for Electrodes 3 to 15. For Electrode 2, however, it was necessary to use the same set of electrodes as Channel 3 (the most apical channel possible with the 4-electrode sQP configuration) in conjunction with an α value of 0 to center the current on electrode 2. This arrangement is referred to as “Channel 2,” even though Electrode 2 is the apical active electrode. The pTP configuration is a variant of the traditional tripolar (TP) configuration. In the TP configuration, there is one intracochlear active electrode, with the return current divided equally between each of the two adjacent, flanking electrodes. The pTP configuration is similar, but only a fraction of the return current is delivered to the flanking electrodes; the remainder flows to the extracochlear ground.
For pTP and sQP configurations, the fraction of the return current varies according to “σ” (J. A. Bierer et al., 2015; Landsberger & Srinivasan, 2009; Srinivasan, Landsberger, & Shannon, 2010). A larger σ results in a narrower electrical field than the MP configuration; for instance, σ = 0 is considered MP, and σ = 1 is considered TP (Litvak et al., 2007). In this study, sQP stimulation, as opposed to pTP, was used for some psychophysical procedures as sQP allows some data to be collected significantly faster, described later. sQP thresholds were found to be equivalent to pTP in another study when the same σ is used (J. A. Bierer et al., 2015).
Most Comfortable Listening Levels
Most comfortable listening levels (MCLs) were measured for use in the PTC procedure described later. MCLs for masker and probe stimuli were determined using the Advanced Bionics clinical loudness scale (Advanced Bionics). To determine the MCL, the current level was increased manually until subjects reported a loudness rating of “6,” or “most comfortable.” The level was changed in 2-dB steps until a loudness rating of 4 was reached; thereafter, the level was changed in 0.5- or 0.1-dB steps depending on subject response. Four sets of MCLs were measured (a) PTC masker stimuli, (b) MP thresholds for PTC probe stimuli, (c) MP thresholds for programming procedures, and (d) pTP thresholds for programming procedures. These levels served as the maximum stimulus level for all psychophysical and programming procedures.
Single-Channel Behavioral Thresholds
Single-channel thresholds were measured for Electrodes 2 to 15 using a sweep threshold procedure (J. A. Bierer et al., 2015). Pulse trains were presented with α value increasing from 0 to 1 in 0.1 steps from Electrodes 2 to 15 for a forward sweep (apical to basal) and from Electrode 15 to 2 (basal to apical) for a backward sweep (based on Sęk, Alcántara, Moore, Kluk, & Wicher, 2005; for details, see J. A. Bierer et al., 2015). A forward and backward sweep was performed for each set of stimuli and averaged. Four sets of sweep thresholds were measured for the same stimuli as the MCLs. These levels served as the minimum stimulus level for all psychophysical and programming procedures.
Sweep Psychophysical Tuning Curves
PTCs were obtained for all available electrodes within a forward-masking paradigm, with a varying masker and fixed probe, using a modified threshold sweep procedure (J. A. Bierer et al., 2015). This procedure is similar to the sweep threshold procedure (see Single-Channel Behavioral Thresholds section), though in this case the masker was swept across the electrode array, varying in level, while the probe remained fixed in level and location. Figure 2 shows PTCs for S53 on all available electrodes; PTCs are plotted as masker level (percentage dynamic range) as a function of masker electrode (apical to basal). S53 had shallower, narrower PTCs apically, indicating minimal presumed channel interaction. Basally, PTCs appeared deeper and broader, indicative of excessive channel interaction in this region.
Figure 2.

PTCs across the electrode array for an example subject (S53). The x-axis denotes the masker electrode (apical to basal). The y-axis represents the masker threshold in percentage dynamic range. The numbered lines inside the plot are probe electrodes, labeled at the tip of the PTC. The mean PTC ERBDR in millimeters is marked inside the plot. ERBDR = equivalent rectangular bandwidth; PTC = psychophysical tuning curve.
Source: Reproduced with permission from DeVries and Arenberg (2018).
PTCs were quantified as a function of masker level, normalized to the masker-alone dynamic range. The equivalent rectangular bandwidth (ERBDR) was used to quantify the spatial extent of masker-probe interaction by equating the PTC to a rectangular function of equivalent minimum masker threshold. For detailed methodology, see DeVries and Arenberg (2018).
Channel Selection and Programs
Channels selected for focused stimulation were based on the median values of CT-estimated electrode-to-modiolus distance and PTC ERBDRs (Figure 3(a)). Those electrodes more distant or with broader tuning than the within-subject median were programmed with the pTP configuration, and all other channels with the MP configuration (Figure 3(b)). This simple criterion was chosen so that each subject had a relatively equal number of channels using focused stimulation (typically 6–8), and as a straightforward starting point for exploring focusing a subset of channels based on CT estimates and PTCs.
Figure 3.

(a) Tuning curve ERBDR as a function of electrode-to-modiolus distance (mm) for S43. The numbers inside the figure indicate channels. The green dashed line is set at the median electrode-to-modiolus distance and the purple dashed line is set to the median PTC ERBDR. (b) Electrode configuration schemes for “Distance,” “Tuning,” “Inverse-Control,” and “Monopolar-Control” programs. Gray boxes are channels that use pTP stimulation, and black boxes are channels that use monopolar stimulation for each program. Channels 1 and 16 are not used because of the nature of sQP stimulation. ERBDR = equivalent rectangular bandwidth; PTC = psychophysical tuning curve; pTP = partial tripolar; sQP = steered quadrupolar.
Four programs were created: (a) “Tuning,” based on PTC ERBDRs; (b) “Distance,” based on CT-estimated electrode-to-modiolus distance; (c) “Inverse-Control” wherein the channels not focused in the Distance program are focused; and (d) “Monopolar-Control,” an all-channel monopolar program.
Programming Procedures
All programs were created for each subject using BEPS+ software version 1.18.26.24691 (Advanced Bionics Corp., Valencia, CA, USA). Table 2 provides subject-specific programming details. The pTP configuration was used for programming procedures as sQP is not available in BEPS+. pTP with σ = .75 was used for electrode focusing, to avoid reaching compliance limits. For S49, σ = .62 was used as σ = .75 caused abnormal auditory percepts (vibrating). For all subjects, electrodes that were not focused used MP stimulation.
Table 2.
Programming and Testing Details.
| ID | SNR (hvD) | SNR (IEEE/HINT*) | Number of channels focused | σ Value | Pulse width | Pulse rate |
|---|---|---|---|---|---|---|
| S22 | +7 | +7 | 7 | .75 | 33.2 | 1,075 |
| S29 | Quiet | Quiet | 8 (CT), 7 (PTC), 6 (Inv) | .75 | 55.7 | 641 |
| S40 | Quiet | +16* | 7 | .75 | 50.3 | 710 |
| S42 | +6 | +11 | 7 | .75 | 28.7 | 1,170 |
| S43 | +11 | +15 | 7 | .75 | 26.9 | 1,326 |
| S46 | Quiet | Quiet* | 7 | .75 | 89.8 | 398 |
| S47 | +6 | +13 | 7 | .75 | 28.7 | 1,243 |
| S49 | Quiet | Quiet* | 7 | .62 | 50.3 | 181 |
| S53 | +6 | +10 | 7 | .75 | 18 | 1,989 |
| S52 | +11 | +17 | 7 | .75 | 18 | 1,989 |
| S55 | +9 | +5 | 7 | .75 | 57.5 | 621 |
| S56 | +10 | +17 | 7 | .75 | 75.4 | 473 |
| S57 | +10 | +9 | 7 | .75 | 44.9 | 795 |
Note. In Table 2, the signal-to-noise ratio (SNR) is used for both medial vowel identification and sentence recognition tasks, number of channels focused in each program (except for Monopolar-Control), the degree of focusing (σ) used, pulse width, and pulse rate for all programs. *denotes use of the HINT. HINT = Hearing in Noise test; IEEE = Institute of Electrical and Electronics Engineers.
Programs were created on a Harmony research processor dedicated for use in the laboratory. All behavioral MCLs and thresholds were converted into charge units for use in BEPS+. All four 14-channel programs used Electrodes 2 through 15; Electrodes 1 and 16 were excluded as they could not serve as active electrodes when using focused stimulation. Clear Voice was consistent with each subject’s clinical, everyday program, and the “extended low” frequency filter settings were maintained for all subjects, and current steering was deactivated. The input dynamic range was set to 60 dB SPL and the gains were set to zero. Pulse width and rate were equal within-subject and across programs, based on the auto pulse width obtained using the program with the most focused channels.
Thresholds and MCLs were entered from the previously conducted psychophysical procedures (see earlier sections). MCL levels were loudness balanced in sets of four electrodes beginning with Electrode 2. The subject was instructed to inform the researcher if the sounds were equally loud. Adjustments were made until all channels were perceived as equally loud.
After balancing M-levels, the volume was reduced on the speech processor, the M-levels were globally reduced by 10 steps, and the microphone was activated through BEPS+. The M-levels were slowly increased until the subject indicated the overall loudness was “Most Comfortable,” or a “6” on the clinical loudness scale. M-levels were then individually adjusted according to subjective reports of loudness and clarity. The Ling sounds were presented and M-levels were adjusted to ensure the subject had access to important consonant and vowel cues that span the speech spectrum. The subject was finally instructed to indicate if the programs sounded equally loud. Once complete, all four programs were converted to Aux Only and loaded onto the processor for testing through direct audio input.
Speech Perception Testing
Using ListPlayer software (Advanced Bionics, Valencia, CA) and direct audio input, subjects listened to randomized, closed-set AZ-Bio sentences (Spahr et al., 2012) in quiet for 15 min before beginning testing with each program; subjects were able to see the sentences on the computer screen, if desired. Stimuli were presented using at 60 dB-A, with Auditech 4-Talker Babble presented at a signal-to-noise ratio (SNR) that reflects approximately 50% performance with the Monopolar-Control program (referred to as “SNR 50”). The SNR was adjusted for each subject, wherein performance between 40% and 60% was accepted; therefore, the noise level was different for each subject. S29, S40, S46, and S49 were unable to reach 40% to 60% performance in quiet, and so all of their testing was performed in quiet. The Monopolar-Control program was always tested first (as this program was used to obtain the SNR 50 noise level); the remaining three programs were randomized and tested. For each vowel identification testing, subjects completed one practice run in quiet with feedback. For sentence recognition testing, the practice run did not have feedback as it was open set testing. After practice, testing was started with the appropriate SNR applied for two test runs (three if scores differed more than 10%). Subjects were blinded to the programs that were tested and did not see their scores following testing.
Vowel stimuli consisted of one female, Pacific Northwest talker, uttering 10 naturally spoken vowels (/i/, /ɪ/, /eɪ/, /ɛ/, /æ/, /ɑ/, /u/, /ʊ/, /o/, /ʌ/) in the /hVd/ context (DiNino, Wright, Winn, & Bierer, 2016). Subjects used a computer mouse to select from the vowels presented on the computer screen. Subjects were given one practice run in quiet and two test runs at SNR 50. Each run consisted of three repetitions of each vowel token. If the two test runs differed by 10% or more, a third run was conducted, and all three runs were averaged.
IEEE (1969) sentences were used for sentence recognition testing. The Institute of Electrical and Electronics Engineers (IEEE) sentences consist of 72 lists of 10 sentences each. These sentences are low context, phonetically balanced, and represent various speech sounds at the same frequency used in everyday English. As this was an open set task, the subject verbally repeated what they heard and the researcher scored each response manually. Subjects were given one practice run in quiet and two test runs at SNR 50. If the two test runs differed by 10% or more, a third run was conducted and all three runs were averaged.
Two subjects, S40 and S49, were unable to reach 40% to 60% scores with the IEEE sentences in quiet, likely because of the open-set and somewhat low context nature of the task. Therefore, the Hearing in Noise test (HINT; Nilsson, Soli, & Sullivan, 1994) was used as these sentences tend to be easier for listeners. The HINT consists of 25 phonetically balanced lists of 10 sentences each. S40 and S49 could perform the task in an open-set manner for all programs when using these materials. As with the IEEE sentences, the subject verbally repeated what they heard, and the researcher scored each subject manually. Subjects were given one practice run in quiet and two test runs at SNR 50. If the two test runs differed by 10% or more, a third run was conducted and all three runs were averaged.
Sound Quality Questionnaire
Following testing with each program, subjects were asked to rate sound quality and clarity on a scale from 1 to 10, in comparison to their everyday program. A rating of “5” was considered equivalent to their everyday program, less than 5 was considered “worse,” and more than 5 was considered “better.” Subjects were asked to rate clarity in quiet, clarity in noise (where applicable), ease of listening, and naturalness for each program.
Statistical Analysis
SPSS statistical software was used to perform within- and between-subjects comparisons (IBM Corp. Released 2015. IBM SPSS Statistics for Windows). A simple linear regression was conducted to determine the within-subject relationship between PTC ERBDR and electrode-to-modiolus distance. In a recent study in which the same subjects participated, PTC ERBDRs measured with the 2IFC procedure in two subjects (S40 and S49) did not significantly differ from those that used the modified threshold sweep procedure (DeVries & Arenberg 2018). Therefore, PTC ERBDRs were compiled for all statistical analyses.
Two planned mixed-model repeated measures linear regressions were performed to investigate the effect of program on medial vowel identification and sentence recognition (Model 1) and on ERBDR–Distance correlation/no correlation groups (Model 2). Duration of deafness was calculated for each participant and included as a covariate because of the presence of two pre- (S49, S53) and one peri-lingually (S40) deafened subject in this data set; these three subjects have similar durations of deafness (41.5, 43, and 46 years, respectively). “Subject” was entered as a random intercept, and “program” and “test” were entered as repeated factors (Baayen, Davidson, & Bates, 2008). A compound symmetry covariance matrix was specified for all models. A Bonferroni correction was applied to all multiple comparisons and is noted where appropriate; all p values reported from this procedure are adjusted for a significance level of α = .05 (S. P. Wright, 1992).
A repeated-measures analysis of variance (RMANOVA) was conducted on all sound quality data; all results are reported with a Greenhouse–Geisser correction to account for a lack of sphericity in the data. A correlational analysis was performed to compare preference and performance across programs.
Results
CT-Estimated Electrode-to-Modiolus Distance
The variability in electrode array positioning is shown in 3D cochlear reconstructions for all subjects, arranged by electrode array type in Figure 1. Electrode-to-modiolus distances ranged from 0.66 to 1.80 mm (Table 3; M = 1.04 mm, SD = .52). In general, the electrode trajectories are consistent with the designs of the four types of arrays, which partially determine how far the electrodes are from the modiolus, and thus how close they are to target auditory neurons. The 1 J electrode array (S29, S40, S46, S52, and S55) has a lateral design, whereas the 1 J Helix (S22, S53) is precurved to achieve a more medial position. The 1 J with positioner (S42, S56), by design, pushes the electrode array even more medially. The Mid-Scala array (S43, S49, S47, S57) is precurved, and designed for midscalar placement to preserve cochlear structures. Because of the small sample size for each electrode array, differences between array types cannot be examined further.
Table 3.
Mean Values and Correlations Between Electrode-to-Modiolus Distance and PTC ERBDR.
| ID | EMD (mm) mean (SD) | Tuning ERB (mm) | r | p |
|---|---|---|---|---|
| S22 | 1.12 (.37) | 2.14 (1.14) | .53 | .05* |
| S29 | 1.52 (.23) | 3.70 (1.37) | .81 | .0004* |
| S40 | 1.79 (.22) | 5.40 (2.40) | .47 | .09 |
| S42 | .64 (.33) | 3.07 (1.73) | .70 | .006* |
| S43 | .84 (.44) | 3.09 (1.48) | .66 | .01* |
| S46 | 1.80 (.34) | 5.51 (2.23) | .17 | .56 |
| S47 | .87 (.46) | 2.61 (.76) | .55 | .04* |
| S49 | .94 (.47) | 2.85 (1.02) | .18 | .55 |
| S52 | .71 (.30) | 2.98 (1.01) | .54 | .05* |
| S53 | .66 (.17) | 2.30 (.96) | .19 | .51 |
| S55 | 1.06 (.26) | 5.81 (1.74) | .28 | .34 |
| S56 | .62 (.33) | 4.51 (2.62) | −.27 | .35 |
| S57 | .90 (.39) | 2.89 (1.27) | .60 | .02* |
| Summary | 1.04 (.52) | 3.60 (1.99) | N/A | N/A |
Note. The left two columns show individual means and standard deviations for electrode-to-modiolus distance and PTC ERBDR. The right two columns show individual Pearson’s r and p values (*indicates statistical significance at < .05 level) for the correlation between electrode-to-modiolus distance and PTC ERBDR. PTC = psychophysical tuning curve; ERBDR = equivalent rectangular bonding; N/A = not applicable; SD = standard deviation; EMD = electrode-to-modiolus distance.
Within-Subject Comparisons Between PTC Bandwidths and Electrode-to-Modiolus Distance
Across subjects, PTC ERBDRs ranged from 0.70 to 10.40 mm (Table 3; M = 3.75 mm, SD = 1.96). PTC ERBDRs and electrode-to-modiolus distance are shown for each subject (Figure 4), with dashed lines indicating the median PTC ERBDR (purple) and median electrode-to-modiolus distance (green). For 7 out of 13 subjects, there was a significant, positive correlation between PTC ERBDR and electrode-to-modiolus distance, wherein electrodes further from the modiolus tended to have broader PTC ERBDRs (Figure 4).
Figure 4.

Tuning curve ERBDR (mm) as a function of electrode-to-modiolus distance (mm) for 13 subjects, arranged by Pearson’s r from highest to lowest. The numbers inside the figure indicate channels. The green dashed line is set at the median electrode-to-modiolus distance and the purple dashed line is set to the median PTC ERBDR. The red line is the best fit line for each subject. ERBDR = equivalent rectangular bandwidth; PTC = psychophysical tuning curve.
Speech Perception Scores
On average, results show that performance is similar with the Monopolar-Control program as with Distance and Tuning, and significantly poorer with the Inverse-Control program for both sentence recognition and vowel identification tasks.
Raw scores (percentage correct) for all programs are presented in the top panel for medial vowel identification (Figure 5(a)), and sentence recognition in the bottom panel (Figure 5(b)). Scores relative to the Monopolar-Control program are presented for medial vowel identification (Figure 6(a)) and sentence recognition (Figure 6(b)), for ease of viewing the relative differences in performance. These figures clearly demonstrate the variability seen in individual benefit from each program.
Figure 5.

(a) Raw scores (percentage correct) on the medial vowel identification task, within (left of dashed line) and across subjects (right of dashed line). Scores are presented for Monopolar-Control (blue), Inverse-Control (red), Distance (green), and Tuning (purple) programs. Brackets with asterisks indicate significance differences between programs. (b) Raw scores (percentage correct) on the sentence recognition task. All subjects used IEEE sentences except S40, S46, and S49, which are marked with an asterisk. All other conventions are the same as the top panel. ERB = equivalent rectangular bandwidth.
Figure 6.

(a) Performance relative to the Monopolar-Control program (percentage correct) on the medial vowel identification task, within (left of dashed line) and across subjects (right of dashed line). Scores are presented for Inverse-Control (red), Distance (green), and Tuning (purple) programs. (b) Performance relative to the Monopolar-Control program (percentage correct) on the sentence recognition task. All subjects used IEEE sentences except S40, S46, and S49, which are marked with an asterisk. All other conventions are the same as the top panel. MP = monopolar.
Results from a linear mixed model analysis show a significant effect of program, F(3, 83.77) = 13.28, p < .0001, across sentence recognition and medial vowel identification tests. There was no effect of duration of deafness, F(1, 28.56) = .28, p = .60, and no interaction between experimental program and tests, F(4, 83.77) = .28, p = .89. After Bonferroni correction, medial vowel identification scores were significantly higher for the Monopolar-Control (p = .03), Distance (p < .001) and Tuning programs (p = .007), as compared with the Inverse-Control program (Figure 6(a) and (b)). Scores for the Distance and Tuning programs were not significantly different from each other (p = .99), or from the Monopolar-Control program (p = .42 and p = 99, respectively).
Sentence recognition scores were significantly higher with the Distance (p = .001) and Tuning programs (p = .02), as compared with the Inverse-Control program. Scores with the Distance and Tuning programs were not significantly different from each other (p = .99) or from the Monopolar-Control program (p = 99). There were no significant differences between the Monopolar-Control and Inverse-Control programs (p = .06), though a trend is evident. As previously mentioned, Subjects S40, S46, and S49 were unable to reach 50% performance in quiet using the IEEE sentences; as a result, the HINT sentences were used for these subjects. To ensure sentence recognition results were not driven by subjects using the HINT sentences, the mixed model was rerun without those subjects. The results are similar with the exception that the Tuning program scores are no longer significantly better than those of the Inverse-Control program (p = .22). Therefore, it is possible that subjects using the HINT test were driving the significant difference between the Tuning and Inverse-Control programs. However, it is unclear whether this is because of the use of the HINT, loss of statistical power, or some other cause. For ease of viewing, these subjects will be presented with the subjects who used the IEEE sentences, with an asterisk to denote the use of the HINT. We opted to present these subjects in the sentence recognition analysis as they represent real CI listeners who may not be able to use preferred clinical materials.
These results suggest that modest improvements in speech perception are possible for some CI listeners when focusing channels suspected of a high degree of channel interaction. The significantly poorer performance on the Inverse-Control program may indicate (a) focusing the “good” channels is detrimental or (b) refusing to focus the “bad” channels is detrimental. Either way, this result suggests that if a subset of channels use focusing, they must be carefully selected to avoid detriments to perception. Speech perception scores between the Distance and Tuning programs did not differ across subjects, but not all subjects’ PTC ERBDRs were correlated with CT-estimated electrode-to-modiolus distance (see Figure 4). For subjects where this relationship was not observed, it is possible that improved performance with the Distance and Tuning programs is because of an aspect of the ENI other than electrode position.
PTC ERBDR and Electrode-to-Modiolus Distance Correlation and No Correlation Groups
Subjects whose PTC ERBDRs were correlated with electrode-to-modiolus distance may receive a different benefit from the Distance and Tuning programs than those without this correlation (see Figure 4). For example, if a subject has broad PTC ERBDRs that are poorly correlated with electrode-to-modiolus distance, there may be a neural health issue at the ENI. It was expected that those with this correlation will perform similarly with the Distance and Tuning programs, whereas those without this correlation were not expected to perform as well with the Tuning program as compared with the Distance program. Figure 7 displays average performance on all programs for both the sentence recognition and medial vowel identification tasks, split between ERBDR–Distance correlation and ERBDR–Distance no correlation groups.
Figure 7.

(a) Raw scores (percentage correct) on the sentence recognition task for ERBDR–Distance correlation (left) and no correlation groups (right). All subjects used IEEE sentences except S40, S46, and S49. All subjects were combined for ease of viewing. Scores are presented for Monopolar-Control (blue), Inverse-Control (red), Distance (green), and Tuning (purple) programs. Brackets with asterisks indicate significance differences between programs. (b) Raw scores (percentage correct) on the medial vowel identification task for ERBDR–Distance correlation (left) and no correlation groups (right). ERBDR = equivalent rectangular bandwidth.
Results from the mixed model show a significant effect of program, F(3, 76.38) = 12.95, p < .0001, across sentence recognition and medial vowel identification tests. There was no effect of duration of deafness, F(1, 30.21) = .16, p = .69, no interaction between program and ERBDR–Distance correlation/no correlation groups, F(3, 76.38) = .58, p = .63, and no interaction between test administered and ERBDR–Distance correlation/no correlation groups, F(8, 80.55) = .51, p = .60.
After Bonferroni correction, for sentence recognition, subjects with the ERBDR–Distance correlation performed better with the Distance program as compared with the Inverse-Control program (p = .02). There were no significant differences between any other programs. For medial vowel identification, subjects with the ERBDR–Distance correlation performed better on Distance (p < .001), Tuning (p = .003), and Monopolar-Control (p = .04) programs as compared with the Inverse-Control program.
For the ERBDR–Distance no correlation group, performance on the Tuning program was significantly better for sentence recognition than with the Inverse-Control program (p = .02), with no other differences between programs. There were no significant differences between programs on the medial vowel identification task for this group.
Figure 8 shows the distribution of consonant–nucleus vowel–consonant (CNC) word scores with the subject’s every day program, split between the ERBDR–Distance correlation/no correlation groups. A univariate analysis of variance was performed to assess whether membership in the ERBDR–Distance correlation/no correlation groups affected performance with subject’s “Everyday” program. The results of this analysis do not reach significance, but suggests a trend toward higher clinical CNC word scores for those in the ERBDR–Distance correlation group, F(1, 12) = 4.15, R2 = .27, p = .067. It may be that when excessive channel interaction is caused by an aspect of the ENI other than electrode position (such as poor neural health), outcomes with the device tend to be poorer.
Figure 8.
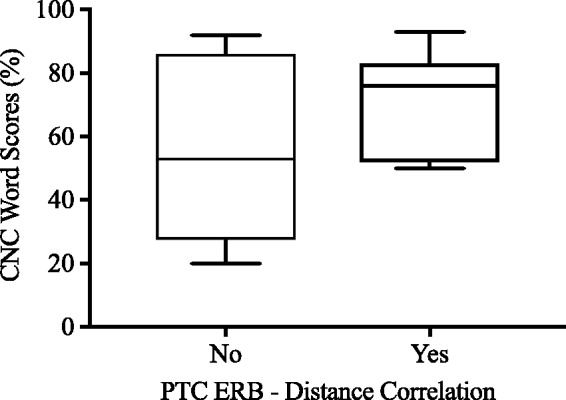
Boxplots showing the distribution of subjects CNC word scores with subject’s everyday program (y-axis) for the ERBDR–Distance no correlation (left) and correlation groups (right). ERBDR = equivalent rectangular bandwidth.
Sound Quality Ratings
A subjective questionnaire was administered for all programs, with a rating scale of 1 (worse than everyday program) to 10 (better than everyday program) on clarity in quiet, clarity in noise (where applicable), ease of listening, and naturalness. Figure 9 shows scatterplots of individual scores and across subject means for each aforementioned quality.
Figure 9.

Scatterplots showing individual (black symbols) and mean (red symbol) sound quality ratings (y-axis) for clarity in quiet (top left), clarity in noise (top right), ease of listening (bottom left), and naturalness (bottom right) for each program tested (x-axis). Note that S49, S46, and S49 were not tested in noise and therefore did not assess clarity in noise. MP = monopolar.
An RMANOVA with a Greenhouse–Geisser correction showed no significant differences in sound quality ratings within-subject and between programs for: clarity in quiet, F(1.8, 19.5) = 1.66, p = .22, clarity in noise, F(2.27, 18.19) = 2.35, p = .12, ease of listening, F(2.52, 27.75) = .787, p = .49, and naturalness, F(2.51, 27.63) = 2.3, p = .11. An additional correlational analysis was conducted to assess if a relationship existed between sound quality ratings and performance. This analysis did not reach significance for both sentence recognition and medial vowel identification (p > .05), suggesting that better performance may not be indicative of subject acceptance of a given program.
However, some within-subject patterns were observable. For example, S43 (downward triangles) gave high ratings for all programs and qualities, perhaps indicating that he felt all the programs were equally suitable, or that he was not particularly sensitive to differences in sound quality. S46 (diamond) performed significantly higher with the Distance program but tended to rate it low compared with the other programs; perhaps his familiarity with monopolar stimulation was an overriding subjective factor. Listeners may have varying “profiles” in how they experience changes in device programming, though extended listener experience is needed to assess this.
Discussion
This study had two aims: (a) to assess the within-subject relationship between electrode-to-modiolus distance and PTC bandwidths, and (b) to reduce channel interaction by creating listener programs that use focused stimulation on electrodes distant from the modiolus or with broad PTC bandwidths. Across subjects, results showed that medial vowel identification and sentence recognition scores for channel interaction reduction strategies were similar to scores for a traditional Monopolar-Control program. Interestingly, when channels were focused for electrodes close to the modiolus (Inverse-Control), performance was significantly reduced across listeners. For those subjects whose electrode-to-modiolus distances correlated with their PTC bandwidths, the aforementioned results held for medial vowel identification, but not for sentence recognition, where only the Distance program resulted in significantly better performance than the Inverse-Control program. Subjects whose PTC bandwidths did not correlate with electrode-to-modiolus distance tended to perform better with the Tuning program on sentence recognition, with no other significant differences observed. Finally, no differences in subjective sound quality ratings were observed across subjects. These results suggest a potential differential benefit of channel interaction reduction strategies based on the relationship between spatial tuning and electrode position.
Within-Subject PTC Bandwidths and Electrode-to-Modiolus Distance
Spatial tuning has been shown to vary along the electrode array within CI listeners. Broad tuning may result in increased channel interaction and reduced spectral resolution abilities (Anderson, Nelson, Kreft, Nelson, & Oxenham, 2011; J. A. Bierer & Faulkner, 2010; DeVries & Arenberg, 2018), possibly because of regions of poor neural health or large electrode-to-modiolus distances. In this study, PTC ERBDRs were correlated with CT-estimated electrode-to-modiolus distance in 7 out of 13 listeners. This is consistent with previous studies that used electrophysiological (Brown, Abbas, & Gantz, 1990; Cohen et al., 2003; Hughes and Abbas 2006; DeVries et al., 2016) and modeling techniques (Briaire & Frijns, 2006) to correlate spread of neural excitation and electrode position.
Figure 8 demonstrated that the relationship between PTC ERBDR and electrode-to-modiolus distance can have an effect on word recognition scores. While a larger sample size is needed to define this relationship, we speculate that subjects in the ERBDR–Distance correlation group were more likely to have better clinical performance and to benefit from channel interaction reduction strategies because most of their channel interaction resulted from poor electrode position. Those subjects in the ERBDR–Distance no correlation group may have received a smaller benefit from channel focusing, as their broader PTCs likely resulted from other aspects of the ENI, such as neural health. We are not aware of any studies that have evaluated PTC bandwidth and electrode position in relation to speech. However, Long et al. (2014) found that subjects whose electrode-to-modiolus distances were well predicted by focused behavioral thresholds performed better on speech perception tasks. Holden et al. (2013) also found that wrapping factor, a 1-point measure that takes into account electrode-to-modiolus distance and cochlear curvature, was significantly related to CNC word scores. However, we did not find this result in a recent study, though that could be because of the smaller sample size of 10 (DeVries et al., 2016). While electrode-to-modiolus distance specifically may not be predictive of speech perception abilities (DeVries & Arenberg, 2018; DeVries et al., 2016; Long et al., 2014; van der Marel et al., 2015), the relationship between psychophysical measures and electrode position may explain some of the variability observed in speech outcomes for CI listeners.
Speech Perception: Channel Focusing
We applied focused stimulation to channels with large electrode-to-modiolus distances and broad PTCs in an effort to reduce channel interaction. The assumption is that narrower current spread will ameliorate the effects of excessive channel interaction and result in improved spectral resolution abilities (e.g., Landsberger, Padilla, & Srinivasan, 2012; Padilla & Landsberger, 2016). Other investigators have used focused stimulation on all channels to compare with traditional MP stimulation. Srinivasan et al. (2013) observed a consistent improvement in speech perception in noise with TP programs across listeners. Berenstein et al. (2008) found some listeners benefited from pTP, and others from MP + current steering. This is similar to J. A. Bierer and Litvak (2016), who found that poorer performing listeners tended to benefit more from the use of pTP stimulation on all channels, and with MP stimulation with high or low threshold channels deactivated; however, using pTP stimulation with high and low threshold channels deactivated was not beneficial for the same listeners. Finally, Arenberg et al. (2018) used dynamic focusing to improve vowel identification; this strategy uses pTP with a variable focusing coefficient depending on the input level (σ values ranging from 0.8 to 0.5 for low to high intensity inputs, respectively). Their results showed an improvement in noise, but no improvement under quiet conditions. Another similar study found that when using dynamic focusing spectral resolution improved, but this did not extend to speech performance (De Jong, Briaire, & Frijns, 2018). These studies show that while results are mixed, channel focusing has the potential to improve speech perception, particularly in noise. However, methodological differences and small sample sizes make across-study interpretation difficult.
Our results show speech perception scores when focusing a subset of channels based on electrode-to-modiolus and PTC bandwidths are similar to traditional MP programs. When channels near the modiolus were focused (Inverse-Control), there was a significant detriment to performance for most listeners. It is possible that using focused stimulation near the modiolus obscures neural representation of spectral information at higher pulse rates, as suggested by Zhou and Pfingst (2016). Further, distant electrodes using monopolar stimulation are presumed to have excessive channel interaction, possibly contributing to the observed detriment in performance. This may provide an explanation for why using focused stimulation on all channels does not benefit all listeners; perhaps these listeners consistently differ in an as-yet unknown manner.
Speech Perception: Electrode-to-Modiolus Distance and PTC Bandwidths
Few studies have used electrode position to create listener strategies with a reduced number of channels. Noble et al. (2013, 2014, 2016) used a CT image-guided technique to identify and deactivate electrodes modeled to have a high degree of channel interaction in both adult and pediatric CI listeners. Subjects were tested on speech and spectral modulation detection tasks with the image-guided strategy and compared with traditional programming in the same ear. Across subjects, they found a small but significant benefit of the experimental strategy and improved subjective quality of communication. It is unclear how the experimental strategy would compare with traditional programming in the same ear, as the contralateral ear was used as the control.
To our knowledge, there are no other studies that have used PTCs to create channel interaction reduction strategies. In this study, performance with the Tuning program was significantly higher than the Inverse-Control program and similar to the Distance and Monopolar-Control programs across subjects.
In this study, performance with the Distance program was not significantly better than with the Monopolar-Control program. This is in contrast to the Noble studies; however, some substantial methodological differences should be noted. We did not use channel deactivation, provide take-home experience, compare our experimental programs with the subject’s every day program, and our method for deriving electrode position differed as well. It may be these differences contributed to the contrast in results. However, scores for both the Distance and Tuning programs were significantly higher than the Inverse-Control program (Figure 5(a) and (b)). This may indicate that when the “wrong” channels are selected for channel focusing, it can be detrimental to speech perception. These results suggest that focusing channels based on a behavioral measure of channel interaction and CT estimates of electrode-to-modiolus distance can result in improved speech perception for some CI listeners, but not all. For example, S22, S46, S47, S52, and S57 showed benefits with the Distance program in particular, whereas S42 and S43 did not. It may be that subjects fit into psychophysical subgroups, where certain subjects will benefit from focusing and others may not.
When considering the ERBDR–Distance correlation and no correlation groups, some interesting patterns emerge (Figure 7). For those in the ERBDR–Distance correlation group, particularly for medial vowel identification, the aforementioned results hold. However, for the ERBDR–Distance no correlation group, only the Tuning program was beneficial compared with the Inverse-Control program for the sentence recognition task. For this group, it may be when focusing channels with broad PTCs the most egregious areas of channel interaction were reduced, allowing these subjects to perform better than expected with the Tuning program. However, as this was not observed for the medial vowel identification task and is not significant when removing the subjects that used the HINT, this finding could be spurious. It may also be that traditional MP programs are more appropriate for some listeners, highlighting the need to identify why some listeners benefit from channel manipulations and others do not. Further, as the Monopolar-Control program was similar to the Distance and Tuning programs across subjects, it is difficult to conclude whether these experimental programs are beneficial enough to warrant long-term use. Several studies have shown that when given long-term exposure, listeners can adapt to new program settings (Fu & Galvin, 2007; Fu, Shannon, & Galvin, 2002).
A future study may examine alternative measures of channel interaction, such as the ECAP, and how it might be used to individualize listener strategies. The peak amplitude of the ECAP response may be more sensitive to neural health than PTC ERBs, though it is unclear how the ECAP peak amplitudes relate to the ERBDR. Studies that provide extended listening experience (a) create more individually tailored PTC programs and (b) combine channel focusing and deactivation, and (c) are necessary to ascertain what benefits are obtainable above and beyond traditional MP programs.
Acknowledgments
The authors would like to acknowledge Kelly Jahn for assistance with data collection, Timothy Holden for analyzing the CT scans, and the subjects for their time and dedication.
Declaration of Conflicting Interests
The authors declared no potential conflicts of interest with respect to the research, authorship, and/or publication of this article.
Funding
The authors disclosed receipt of the following financial support for the research, authorship, and/or publication of this article: The authors would like to acknowledge and thank their funding sources RO1 DC012142 (JGA) and T32 DC 000033 (University of Washington Speech and Hearing Sciences: LAD).
References
- Abbas P. J., Hughes M. L., Brown C. J., Miller C. A., South H. (2004) Channel interaction in cochlear implant users evaluated using the electrically evoked compound action potential. Audiology and Neurootology 9(4): 203–213. doi:10.1159/000078390. [DOI] [PubMed] [Google Scholar]
- Anderson E. S., Nelson D. A., Kreft H., Nelson P. B., Oxenham A. J. (2011) Comparing spatial tuning curves, spectral ripple resolution, and speech perception in cochlear implant users. The Journal of the Acoustical Society of America 130(1): 364–375. doi: 10.1121/1.3589255. [DOI] [PMC free article] [PubMed] [Google Scholar]
- Arenberg J. G., Parkinson W. S., Litvak L., Chen C., Kreft H. A., Oxenham A. J. (2018) A dynamically focusing cochlear implant strategy can improve vowel identification in noise. Ear and Hearing. doi:10.1097/AUD.0000000000000566. [DOI] [PMC free article] [PubMed] [Google Scholar]
- Baayen R. H., Davidson D. J., Bates D. M. (2008) Mixed-effects modeling with crossed random effects for subjects and items. Journal of Memory and Language 59(4): 390–412. doi:10.1016/j.jml.2007.12.005. [Google Scholar]
- Berenstein C. K., Mens L. H., Mulder J. J., Vanpoucke F. J. (2008) Current steering and current focusing in cochlear implants: Comparison of monopolar, tripolar, and virtual channel electrode configurations. Ear and Hearing 29(2): 250–260. doi: 0196/0202/08/2902-0250/0. [DOI] [PubMed] [Google Scholar]
- Bierer J. (2010) Probing the electrode–neuron interface with focused cochlear implant stimulation. Trends in Amplification 14(2): 84–95. doi:10.1177/1084713810375249. [DOI] [PMC free article] [PubMed] [Google Scholar]
- Bierer J. A. (2007) Threshold and channel interaction in cochlear implant users: Evaluation of the tripolar electrode configuration. The Journal of the Acoustical Society of America 121(3): 1642–1653. doi:10.1121/1.2436712. [DOI] [PubMed] [Google Scholar]
- Bierer J. A., Bierer S. M., Kreft H. A., Oxenham A. J. (2015) A fast method for measuring psychophysical thresholds across the cochlear implant array. Trends in Hearing 19: 1–12. doi:10.1177/2331216515569792. [DOI] [PMC free article] [PubMed] [Google Scholar]
- Bierer J. A., Faulkner K. F. (2010) Identifying cochlear implant channels with poor electrode–neuron interface: Partial tripolar, single-channel thresholds and psychophysical tuning curves. Ear and Hearing 31(2): 247, doi: 10.1097/AUD.0b013e3181c7daf4. [DOI] [PMC free article] [PubMed] [Google Scholar]
- Bierer J. A., Litvak L. (2016) Reducing channel interaction through cochlear implant programming may improve speech perception: Current focusing and channel deactivation. Trends in Hearing 20: 233121651665338, doi:10.1177/2331216516653389. [DOI] [PMC free article] [PubMed] [Google Scholar]
- Briaire J. J., Frijns J. H. M. (2006) The consequences of neural degeneration regarding optimal cochlear implant position in scala tympani: A model approach. Hearing Research 214(1–2): 17–27. doi:10.1016/j.heares.2006.01.015. [DOI] [PubMed] [Google Scholar]
- Brown C. J., Abbas P. J., Gantz B. (1990) Electrically evoked whole-nerve action potentials: Data from human cochlear implant users. The Journal of the Acoustical Society of America 88(3): 1385–1391. [DOI] [PubMed] [Google Scholar]
- Cohen L. T. (2009) Practical model description of peripheral neural excitation in cochlear implant recipients: 1. Growth of loudness and ECAP amplitude with current. Hearing Research 247(2): 87–99. doi:10.1016/j.heares.2008.11.003. [DOI] [PubMed] [Google Scholar]
- Cohen L. T., Richardson L. M., Saunders E., Cowan R. S. (2003) Spatial spread of neural excitation in cochlear implant recipients: Comparison of improved ECAP method and psychophysical forward masking. Hearing Research 179(1–2): 72–87. doi:10.1016/S0378-5955(03)00096-0. [DOI] [PubMed] [Google Scholar]
- Cohen L. T., Saunders E., Clark G. M. (2001) Psychophysics of a prototype peri-modiolar cochlear implant electrode array. Hearing Research 155(1): 63–81. [DOI] [PubMed] [Google Scholar]
- de Jong M. A. M., Briaire J. J., Frijns J. H. M. (2018) Dynamic current focusing: A novel approach to loudness coding in cochlear implants. Ear and Hearing. doi:10.1097/AUD.0000000000000593. [DOI] [PubMed] [Google Scholar]
- DeVries L., Scheperle R., Bierer J. A. (2016) Assessing the electrode–neuron interface with the electrically evoked compound action potential, electrode position, and behavioral thresholds. Journal of the Association for Research in Otolaryngology 17(3): 237–252. doi:10.1007/s10162-016-0557-9. [DOI] [PMC free article] [PubMed] [Google Scholar]
- DeVries, L., & Arenberg J. G. (2018). Psychophysical Tuning Curves as a Correlate of Electrode Position in Cochlear Implant Listeners. Journal of the Association for Research in Otolaryngology. doi: 10.1007/s10162-018-0678-4. [DOI] [PMC free article] [PubMed]
- DiNino M., Wright R. A., Winn M. B., Bierer J. A. (2016) Vowel and consonant confusions from spectrally manipulated stimuli designed to simulate poor cochlear implant electrode–neuron interfaces. The Journal of the Acoustical Society of America 140(6): 4404–4418. doi:10.1121/1.4971420. [DOI] [PMC free article] [PubMed] [Google Scholar]
- Finley C. C., Holden T. A., Holden L. K., Whiting B. R., Chole R. A., Neely G. J., Skinner M. W. (2008) Role of electrode placement as a contributor to variability in cochlear implant outcomes. Otology & Neurotology: Official Publication of the American Otological Society, American Neurotology Society [and] European Academy of Otology and Neurotology 29(7): 920–928. doi:10.1097/MAO.0b013e318184f492. [DOI] [PMC free article] [PubMed] [Google Scholar]
- Frijns J. H., de Snoo S. L., Schoonhoven R. (1995) Potential distributions and neural excitation patterns in a rotationally symmetric model of the electrically stimulated cochlea. Hearing Research 87(1–2): 170–186. [DOI] [PubMed] [Google Scholar]
- Fu Q-J., Galvin J. J. (2007) Perceptual learning and auditory training in cochlear implant recipients. Trends in Amplification 11(3): 193–205. doi:10.1177/1084713807301379. [DOI] [PMC free article] [PubMed] [Google Scholar]
- Fu Q-J., Shannon R. V., Galvin J. J. (2002) Perceptual learning following changes in the frequency-to-electrode assignment with the Nucleus-22 cochlear implant. The Journal of the Acoustical Society of America 112(4): 1664–1674. doi:10.1121/1.1502901. [DOI] [PubMed] [Google Scholar]
- Garadat S. N., Zwolan T. A., Pfingst B. E. (2013) Using temporal modulation sensitivity to select stimulation sites for processor MAPs in cochlear implant listeners. Audiology and Neurotology 18(4): 247–260. doi:10.1159/000351302. [DOI] [PMC free article] [PubMed] [Google Scholar]
- Goldwyn J. H., Bierer S. M., Bierer J. A. (2010) Modeling the electrode–neuron interface of cochlear implants: Effects of neural survival, electrode placement, and the partial tripolar configuration. Hearing Research 268(1–2): 93–104. doi:10.1016/j.heares.2010.05.005. [DOI] [PMC free article] [PubMed] [Google Scholar]
- Hall R. D. (1990) Estimation of surviving spiral ganglion cells in the deaf rat using the electrically evoked auditory brainstem response. Hearing Research 49(1–3): 155–168. [DOI] [PubMed] [Google Scholar]
- Henshall K. R., McKay C. M. (2001) Optimizing electrode and filter selection in cochlear implant speech processor maps. Journal of the American Academy of Audiology 12(9): 478–489. [PubMed] [Google Scholar]
- Holden L. K., Finley C. C., Firszt J. B., Holden T. A., Brenner C., Potts L. G., Skinner M. W. (2013) Factors affecting open-set word recognition in adults with cochlear implants. Ear and Hearing 34(3): 342–360. doi:10.1097/AUD.0b013e3182741aa7. [DOI] [PMC free article] [PubMed] [Google Scholar]
- Hughes M. L., Abbas P. J. (2006) Electrophysiologic channel interaction, electrode pitch ranking, and behavioral threshold in straight versus perimodiolar cochlear implant electrode arrays. The Journal of the Acoustical Society of America 119(3): 1538–1547. doi:10.1121/1.2164969. [DOI] [PubMed] [Google Scholar]
- IEEE Recommended Practice for Speech Quality Measurements (1969). IEEE Transactions on Audio and Electroacoustics17(3): 225–246. doi: 10.1109/TAU.1969.1162058.
- Jolly C. N., Spelman F. A., Clopton B. M. (1996) Quadrupolar stimulation for cochlear prostheses: Modeling and experimental data. IEEE Transactions on Biomedical Engineering 43(8): 857–865. doi: 10.1109/10.508549. [DOI] [PubMed] [Google Scholar]
- Jones G. L., Ho Won J., Drennan W. R., Rubenstein J. T. (2013) Relationship between channel interaction and spectral-ripple discrimination in cochlear implant users. The Journal of the Acoustical Society of America 133(1): 425–433. doi:10.1121/1.4768881. [DOI] [PMC free article] [PubMed] [Google Scholar]
- Kalkman R. K., Briaire J. J., Dekker D. M. T., Frijns J. H. (2014) Place pitch versus electrode location in a realistic computational model of the implanted human cochlea. Hearing Research 315: 10–24. doi:10.1016/j.heares.2014.06.003. [DOI] [PubMed] [Google Scholar]
- Kawano A., Seldon H. L., Clark G. A., Ramsden R. T., Raine C. H. (1998) Intracochlear factors contributing to psychophysical percepts following cochlear implantation. Acta Oto-Laryngologica 118(3): 313–326. doi:10.1080/00016489850183386. [DOI] [PubMed] [Google Scholar]
- Khan A. M., Handzel O., Damian D., Eddington D. K., Nadol J. B., Jr. (2005) Effect of cochlear implantation on residual spiral ganglion cell count as determined by comparison with the contralateral nonimplanted inner ear in humans. The Annals of Otology, Rhinology, and Laryngology 114(5): 381–385. doi:10.1177/000348940511400508. [DOI] [PubMed] [Google Scholar]
- Landsberger D. M., Padilla M., Srinivasan A. G. (2012) Reducing current spread using current focusing in cochlear implant users. Hearing Research 284(1–2): 16–24. doi:10.1016/j.heares.2011.12.009. [DOI] [PMC free article] [PubMed] [Google Scholar]
- Landsberger D. M., Srinivasan A. G. (2009) Virtual channel discrimination is improved by current focusing in cochlear implant recipients. Hearing Research 254(1–2): 34–41. doi:10.1016/j.heares.2009.04.007. [DOI] [PMC free article] [PubMed] [Google Scholar]
- Linthicum F. H., Fayad J., Otto S. R., Galey F. R., House W. F. (1991) Cochlear implant histopathology. The American Journal of Otology 12(4): 245–311. [PubMed] [Google Scholar]
- Litvak L. M., Spahr A. J., Saoji A. A., Fridman G. Y. (2007) Relationship between perception of spectral ripple and speech recognition in cochlear implant and vocoder listeners. The Journal of the Acoustical Society of America 122(2): 982–991. doi:10.1121/1.2749413. [DOI] [PubMed] [Google Scholar]
- Long C. J., Holden T. A., McClelland G. H., Parkinson W. S., Shelton C., Kelsall D. C., Smith Z. M. (2014) Examining the electro-neural interface of cochlear implant users using psychophysics, CT scans, and speech understanding. Journal of the Association for Research in Otolaryngology 15(2): 293–304. doi:10.1007/s10162-013-0437-5. [DOI] [PMC free article] [PubMed] [Google Scholar]
- Nadol J. B. (1997) Patterns of neural degeneration in the human cochlea and auditory nerve: Implications for cochlear implantation. Otolaryngology—Head and Neck Surgery 117(3): 220–228. [DOI] [PubMed] [Google Scholar]
- Nelson D. A., Donaldson G. S., Kreft H. (2008) Forward-masked spatial tuning curves in cochlear implant users. The Journal of the Acoustical Society of America 123(3): 1522–1543. doi:10.1121/1.2836786. [DOI] [PMC free article] [PubMed] [Google Scholar]
- Nilsson M., Soli S. D., Sullivan J. A. (1994) Development of the Hearing in Noise Test for the measurement of speech reception thresholds in quiet and in noise. The Journal of the Acoustical Society of America 95(2): 1085–1099. [DOI] [PubMed] [Google Scholar]
- Noble J. H., Gifford R. H., Hedley-Williams A. J., Dawant B. M., Labadie R. F. (2014) Clinical evaluation of an image-guided cochlear implant programming strategy. Audiology and Neurotology 19(6): 400–411. doi:10.1159/000365273. [DOI] [PMC free article] [PubMed] [Google Scholar]
- Noble J. H., Hedley-Williams A. J., Sunderhaus L., Dawant B. M., Labadie R. F., Camarata S. M., Gifford R. H. (2016) Initial results with image-guided cochlear implant programming in children. Otology & Neurotology 37(2): e63–e69. [DOI] [PMC free article] [PubMed] [Google Scholar]
- Noble J. H., Labadie R. F., Gifford R. H., Dawant B. M. (2013) Image-guidance enables new methods for customizing cochlear implant stimulation strategies. IEEE Transactions on Neural Systems and Rehabilitation Engineering 21(5): 820–829. doi: 10.1097/MAO.0000000000000909. [DOI] [PMC free article] [PubMed] [Google Scholar]
- Padilla M., Landsberger D. M. (2016) Reduction in spread of excitation from current focusing at multiple cochlear locations in cochlear implant users. Hearing Research 333: 98–107. doi:10.1016/j.heares.2016.01.002. [DOI] [PMC free article] [PubMed] [Google Scholar]
- Pfingst B. E., Xu L., Thompson C. S. (2004) Across-site threshold variation in cochlear implants: Relation to speech recognition. Audiology and Neuro-Otology 9(6): 341–352. doi:10.1159/000081283. [DOI] [PMC free article] [PubMed] [Google Scholar]
- Saleh S. M., Saeed S. R., Meerton L., Moore D. R., Vickers D. A. (2013) Clinical use of electrode differentiation to enhance programming of cochlear implants. Cochlear Implants International 14(Suppl 4): S16–S18. doi:10.1179/1467010013Z.000000000125. [DOI] [PubMed] [Google Scholar]
- Sęk A., Alcántara J., Moore B. C. J., Kluk K., Wicher A. (2005) Desarrollo de un método rápido para determinar curvas psicofísicas de sintonía [Development of a fast method for determining psychophysical tuning curves]. International Journal of Audiology 44(7): 408–420. doi:10.1080/14992020500060800. [DOI] [PubMed] [Google Scholar]
- Shepherd R. K., Hatsushika S., Clark G. M. (1993) Electrical stimulation of the auditory nerve: The effect of electrode position on neural excitation. Hearing Research 66(1): 108–120. [DOI] [PubMed] [Google Scholar]
- Shepherd R. K., Javel E. (1997) Electrical stimulation of the auditory nerve. I. Correlation of physiological responses with cochlear status. Hearing Research 108(1): 112–144. [DOI] [PubMed] [Google Scholar]
- Skinner M. W., Holden T. A., Whiting B. R., Voie A. H., Brunsden B., Neely J. G., Finley C. C. (2007) In vivo estimates of the position of advanced bionics electrode arrays in the human cochlea. Annals of Otology, Rhinology & Laryngology 116(4): 2–24. [PubMed] [Google Scholar]
- Skinner M. W., Ketten D. R., Holden L. K., Harding G. W., Smith P. G., Gates G. A., Blocker B. (2002) CT-derived estimation of cochlear morphology and electrode array position in relation to word recognition in nucleus-22 recipients. Journal of the Association for Research in Otolaryngology 3(3): 332–350. doi:10.1007/s101620020013. [DOI] [PMC free article] [PubMed] [Google Scholar]
- Smith L., Simmons F. B. (1983) Estimating eighth nerve survival by electrical stimulation. The Annals of Otology, Rhinology, and Laryngology 92(1 Pt 1): 19–23. doi:10.1177/000348948309200105. [DOI] [PubMed] [Google Scholar]
- Spahr A. J., Dorman M. F., Litvak L. M., Van Wie S., Gifford R. H., Loizou P. C., Cook S. (2012) Development and validation of the AzBio sentence lists. Ear and Hearing 33(1): 112–117. doi:10.1097/AUD.0b013e31822c2549. [DOI] [PMC free article] [PubMed] [Google Scholar]
- Srinivasan A. G., Landsberger D. M., Shannon R. V. (2010) Current focusing sharpens local peaks of excitation in cochlear implant stimulation. Hearing Research 270(1–2): 89–100. doi:10.1016/j.heares.2010.09.004. [DOI] [PMC free article] [PubMed] [Google Scholar]
- Srinivasan A. G., Padilla M., Shannon R. V., Landsberger D. M. (2013) Improving speech perception in noise with current focusing in cochlear implant users. Hearing Research 299: 29–36. doi:10.1016/j.heares.2013.02.004. [DOI] [PMC free article] [PubMed] [Google Scholar]
- Teymouri J., Hullar T. E., Holden T. A., Chole R. A. (2011) Verification of computed tomographic estimates of cochlear implant array position: A micro-CT and histologic analysis. Otology & Neurotology: Official Publication of the American Otological Society, American Neurotology Society [and] European Academy of Otology and Neurotology 32(6): 980–986. doi:10.1097/MAO.0b013e3182255915. [DOI] [PMC free article] [PubMed] [Google Scholar]
- Throckmorton C. S., Collins L. M. (1999) Investigation of the effects of temporal and spatial interactions on speech-recognition skills in cochlear-implant subjects. The Journal of the Acoustical Society of America 105(2): 861–873. [DOI] [PubMed] [Google Scholar]
- van der Marel, K. S., Briaire, J. J., Verbist B. M., Muurling, T. J., & Frijns, J. H. (2015) The Influence of Cochlear Implant Electrode Position on Performance. Audiology and Neurotology20(3): 202–211. doi: 10.1159/000377616. [DOI] [PubMed]
- Verbist B. M., Frijns J. H., Geleijns J., van Buchem M. A. (2005) Multisection CT as a valuable tool in the postoperative assessment of cochlear implant patients. American Journal of Neuroradiology 26(2): 424–429. [PMC free article] [PubMed] [Google Scholar]
- Vickers D., Degun A., Canas A., Stainsby T., Vanpoucke F. (2016) Deactivating cochlear implant electrodes based on pitch information for users of the ACE strategy. In: Dijk P. van, Baş kent D., Gaudrain E., Kleine E. de, Wagner A., Lanting C. (eds) Physiology, psychoacoustics and cognition in normal and impaired hearing, Champaign, IL: Springer International Publishing, pp. 115–123. doi:10.1007/978-3-319-25474-6_13. [Google Scholar]
- Won J. H., Drennan W. R., Rubinstein J. T. (2007) Spectral-ripple resolution correlates with speech reception in noise in cochlear implant users. Journal of the Association for Research in Otolaryngology 8(3): 384–392. doi:10.1007/s10162-007-0085-8. [DOI] [PMC free article] [PubMed] [Google Scholar]
- Wright S. P. (1992) Adjusted p-values for simultaneous inference. Biometrics 48(4): 1005, . doi:10.2307/2532694. [Google Scholar]
- Zhou N., Pfingst B. E. (2012) Psychophysically based site selection coupled with dichotic stimulation improves speech recognition in noise with bilateral cochlear implants. The Journal of the Acoustical Society of America 132(2): 994–1008. doi:10.1121/1.4730907. [DOI] [PMC free article] [PubMed] [Google Scholar]
- Zhou N., Pfingst B. E. (2016) Evaluating multipulse integration as a neural-health correlate in human cochlear-implant users: Relationship to spatial selectivity. The Journal of the Acoustical Society of America 140(3): 1537–1547. doi: 10.1121/1.4962230. [DOI] [PMC free article] [PubMed] [Google Scholar]
- Zhou, N., Dong, L., & Hang, M. (2017). Evaluating Multipulse Integration as a Neural-Health Correlate in Human Cochlear Implant Users: Effects of Stimulation Mode. Journal of the Association for Research in Otolaryngology, 19, 99–111. doi: 10.1007/s10162-017-0643-7. [DOI] [PMC free article] [PubMed]
- Zwolan T. A., Collins L. M., Wakefield G. H. (1997) Electrode discrimination and speech recognition in postlingually deafened adult cochlear implant subjects. The Journal of the Acoustical Society of America 102(6): 3673–3685. doi:10.1121/1.420401. [DOI] [PubMed] [Google Scholar]